fircls
Calculation of coefficients of a multiband FIR filter using the least squares method with constraints.
| Library |
|
Syntax
Function call
-
b = fircls(n,f,amp,up,lo)— generates coefficientsbFIR filter with linear phase response lengthn+1. The amplitude-frequency characteristics of this filter match those of the vectorsfandamp. Vectorsupandlohave the same length asamp. They define the upper and lower limits of the frequency response in each band.
Arguments
Input arguments
# n — filter order
+
a real-valued positive scalar
Details
The filter order, given as a real positive scalar.
Function fircls always uses an even filter order for configurations with Nyquist frequency bandwidth (i.e., high-pass filters and notch filters). This is due to the fact that for odd orders of magnitude, the frequency response at the Nyquist frequency is necessarily equal to 0. If an odd value is specified n, fircls will increase it by 1.
|
# f — normalized frequency points
+
a real-valued vector
Details
Normalized frequency points defined as a real-valued vector. The transition frequencies are in the range [0,1], where 1 corresponds to the Nyquist frequency. The first point f must be equal to 0, and the last one — 1. The frequencies should be arranged in ascending order.
# lo — lower bounds
+
a real-valued vector
Details
The lower bounds of the frequency response in each band, defined as a real-valued vector of the same length as amp.
Usually, the lower value in the delay band is indicated as negative. During installation lo an equal 0 in the delay bands, a non-negative amplitude of the frequency response is obtained. Such filters are spectrally factorized to obtain filters with minimal phase.
|
Name-value input arguments
# out — display parameters for calculating filter coefficients
+
:plot | :both
Details
Display parameters for calculating the filter coefficients, set using one of the following methods:
-
:plot— display of a set of graphs showing the amplitude-frequency response of the filter in the entire bandwidth and an enlarged image of the amplitude-frequency response in each section of the bandwidth. The function updates all graphs at each iteration step. The zeros on the graph are the estimated extremes of the new iteration, and the crosses are the estimated extremes of the previous iteration, where the extremes are the peaks (maxima and minima) of the filter ripples. Only those pulsations for which the zeros and crosses match are considered equal. -
:both— display of both text information and graphs.
Examples
Calculation of low-pass filter coefficients using the least squares method with constraints
Details
Calculate the low-pass filter coefficients 150-th order with a normalized cutoff frequency rad/countdown. We will specify the maximum absolute error 0.02 in the bandwidth and 0.01 in the detention area. We will display the calculation error and the amplitude-frequency characteristics of the filter. Boundary violations indicate iterations of the procedure as the calculation converges.
import EngeeDSP.Functions: fircls

n = 150
f = [0 0.4 1]
a = [1 0]
up = [1.02 0.01]
lo = [0.98 -0.01]
b = fircls(n, f, a, up, lo; out = :both)
Bound Violation = 0.0788344298965972
Bound Violation = 0.009613774499764091
Bound Violation = 0.0005681345753413645
Bound Violation = 5.151994189609224e-6
Bound Violation = 3.486559452259286e-8
Bound Violation = 6.230728155642851e-10
1×151 Matrix{Float64}:
-0.00119101 -0.0040614 … -0.00119101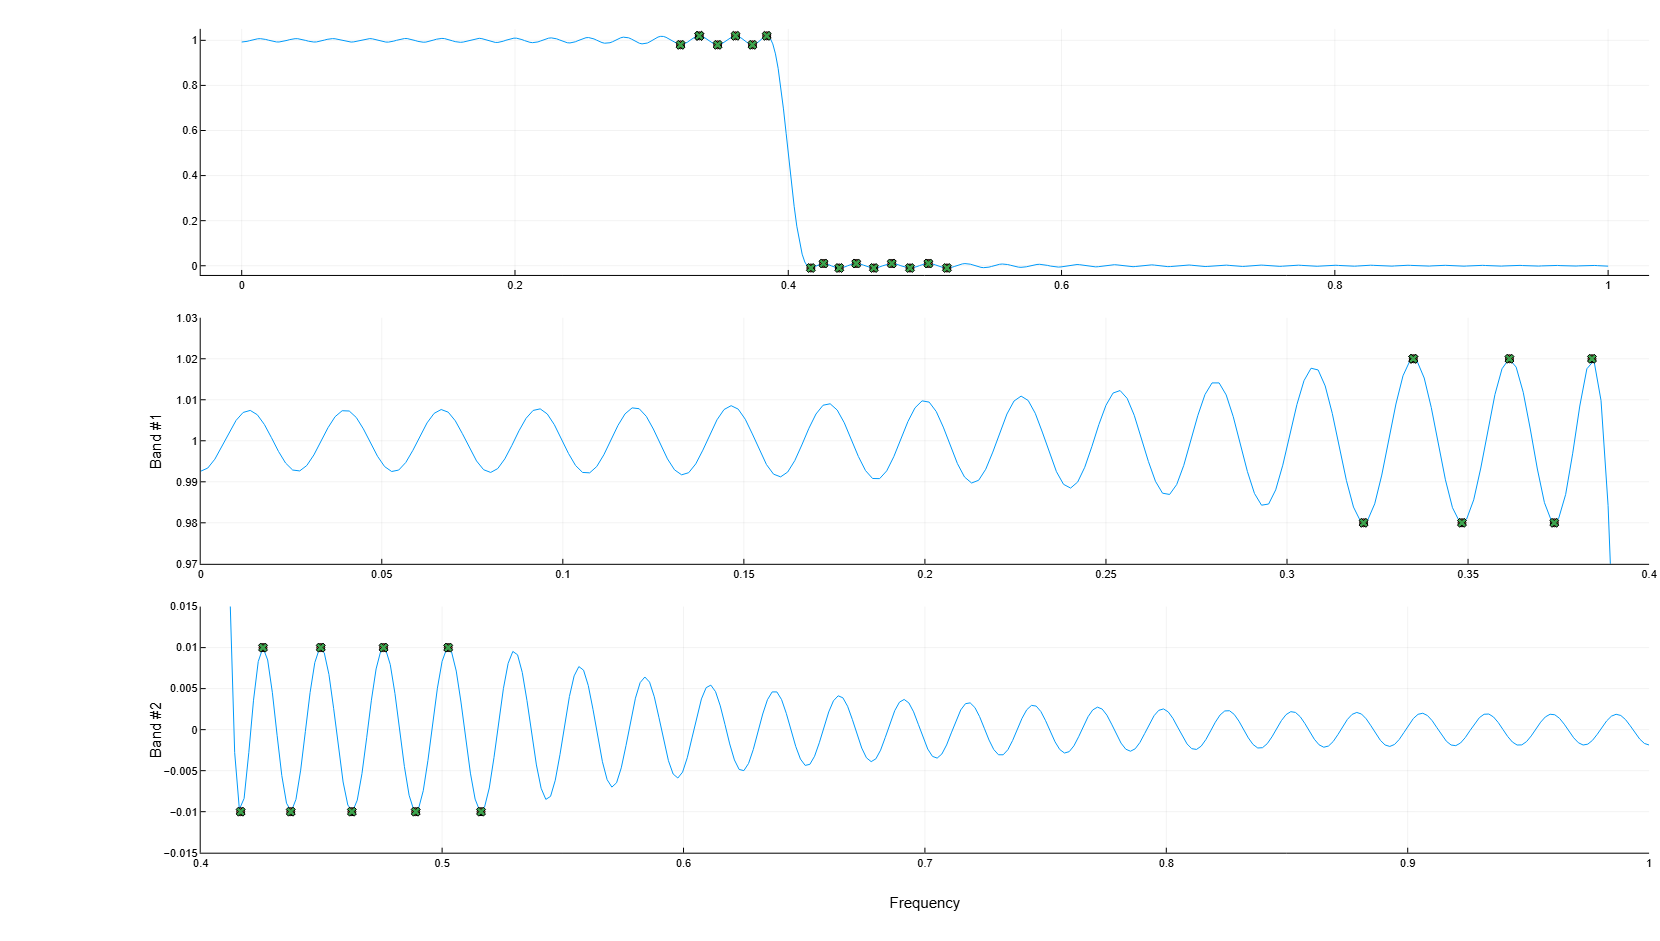
Algorithms
Function fircls uses an iterative least squares algorithm to obtain a uniform pulsating frequency response. The algorithm is a multiple exchange algorithm using Lagrange multipliers and Kuhn—Tucker conditions at each iteration.
Literature
-
Selesnick, I. W., M. Lang, and C. S. Burrus. «Constrained Least Square Design of FIR Filters without Specified Transition Bands.» Proceedings of the 1995 International Conference on Acoustics, Speech, and Signal Processing. Vol. 2, 1995, pp. 1260–1263.
-
Selesnick, I. W., M. Lang, and C. S. Burrus. «Constrained Least Square Design of FIR Filters without Specified Transition Bands.» IEEE® Transactions on Signal Processing. Vol. 44, Number 8, 1996, pp. 1879–1892.