alignsignals
Aligns the two signals by delaying the earliest signal.
| Library |
|
Syntax
Function call
-
xa, ya, D = alignsignals(x, y)— evaluates the delayDbetween two input signalsxandyand returnsDtogether with the aligned signalsxaandya. The function estimates the delay using cross-correlation.The input signals do not have to be exact retarded copies of each other. However, the signals can only be precisely aligned if there is sufficient correlation between them. For more information about estimating covariance and correlation, see [1].
-
xa, ya, D = alignsignals(x, y, Name=Value)— also uses argumentsName=Value, which include an estimation method and an option for truncating input signals. For example, to estimate the delay based on the location of the largest peak in each signal, set for the argumentMethodmeaning"maxpeak".
Arguments
Input arguments
# x is the first input signal
+
vector
Details
The first input signal, specified as a numeric vector of length .
| Data types |
|
| Support for complex numbers |
Yes |
# y is the second input signal
+
vector
Details
The second input signal, specified as a numeric vector of length .
| Data types |
|
| Support for complex numbers |
Yes |
Name-value input arguments
Specify optional argument pairs in the format Name=Value, where Name — the name of the argument, and Value — the appropriate value. Type arguments Name=Value they should be placed after the other arguments, but the order of the pairs does not matter.
# Method is a method for estimating the delay between signals
+
"xcorr" (by default) | "maxpeak" | "npeak" | "risetime"
Details
A method for estimating the delay between signals specified as "xcorr", "maxpeak", "npeak" or "risetime". You can specify additional name-value arguments depending on the specified Method:
-
"xcorr"— delay estimation using cross-correlation. If the method is specified as"xcorr", then you can also specifyMaxLag; -
"maxpeak"— Delay estimation using the position of the highest peak in each signal. If the method is specified as"maxpeak", then you can additionally specifyMinPeakProminenceandMinPeakHeight; -
"npeak"— estimation of delay using position -th peak in each signal. If the method is specified as"npeak", then you can additionally specifyPeakNum,MinPeakProminenceandMinPeakHeight; -
"risetime"— delay estimation using the position of the rising edges in each signal. The function uses the specified valuesStateLevelsto search for rising fronts.
# MaxLag — maximum window size
+
scalar
Details
The maximum window size used to estimate the delay between signals is set as an integer scalar. By default MaxLag equal to , where — length x, and — length y. If MaxLag if it is negative, then the function uses the absolute value.
This argument is used only if for the argument Method the value is set "xcorr".
| Data types |
|
# MinPeakProminence — minimum peak elevation
+
scalar
Details
The minimum peak elevation used to identify peaks in the signals is given as a real non-negative scalar. When specifying MinPeakProminence The function finds peaks whose relative importance is not less than the specified value. For more information, see the section Elevations.
This argument is used only if for the argument Method the value is set "npeak" or "maxpeak".
| Data types |
|
# MinPeakHeight — minimum peak height
+
scalar
Details
The minimum peak height used to determine the peaks in the signals is given as a real scalar. When specifying MinPeakHeight the function finds peaks whose height exceeds the specified value. For more information, see findpeaks.
This argument is used only if for the argument Method the value is set "npeak" or "maxpeak".
| Data types |
|
# StateLevels — state levels
+
A two-element vector is a string
Details
The state levels are specified as a real two-element vector string. The first element corresponds to the low state level of the input signals, and the second element corresponds to the high state level of the input signals. If the value is StateLevels If not specified, the function evaluates the state levels of the input signal using the histogram method.
For more information, see risetime.
This argument is used only if for the argument Method the value is set "risetime".
| Data types |
|
# Truncate — option for truncating input signals
+
false (0) (by default) | true (1)
Details
The option of truncating input signals, set by numeric or logical true (1) or false (0). When specifying the value true (1) for the argument Truncate lengths xa and ya equal to the lengths x and y accordingly.
-
If the estimated delay is
Dif it is positive, then the function addsDzeros toxand truncates the last onesDcountsx. -
If
Dif it is negative, then the function adds−Dzeros toyand truncates the last onesDcountsy. -
If
DThenxaconsists of zeros, and all countsxthey get lost. If−DThenyaconsists of zeros, and all countsythey get lost.
Output arguments
Examples
Equalization of two signals if the first signal is three samples behind
Details
Create two signals: x and y. The signal x — it’s the same as y, except that you have x There are three zeros at the beginning and one extra at the end. Align the two signals.
import EngeeDSP.Functions: alignsignals

x = [0, 0, 0, 1, 2, 3, 0, 0]
y = [1, 2, 3, 0]

xa, ya, D = alignsignals(x, y)
(xa = [0, 0, 0, 1, 2, 3, 0, 0], ya = [0, 0, 0, 1, 2, 3, 0], D = -3)Equalization of two signals if the second signal is two samples behind
Details
Create two signals: x and y. The signal y — it’s the same as x, except that y it is delayed for two counts. Align the two signals.
import EngeeDSP.Functions: alignsignals

x = [1, 2, 3]
y = [0, 0, 1, 2, 3]

xa, ya, D = alignsignals(x, y)
(xa = [0, 0, 1, 2, 3], ya = [0, 0, 1, 2, 3], D = 2)Align the signals using the maximum window size 1:
maxlag = 1
xa, ya, D = alignsignals(x, y, Method="xcorr", MaxLag=maxlag)
(xa = [0, 1, 2, 3], ya = [0, 0, 1, 2, 3], D = 1)Alignment of two two-level signals along rising edges
Details
We will generate two signals representing two-level signals. The signals have a sampling frequency 50 Hz during 20 seconds. For the first signal, the transition occurs via 13 seconds after the start of the measurement. For the second signal, the transition occurs via 5 seconds after the start of the measurement. The signals have different amplitudes and are in white Gaussian noise with different variances. Let’s plot the signal graphs.
t = range(0, 20, length=1001)

e1 = 1.4 .* tanh.(t .- 13) .+ randn(length(t)) ./ 3
e2 = tanh.(3 .* (t .- 5)) .+ randn(length(t)) ./ 5

plot(t, e1, label="e1")
plot!(t, e2, label="e2")
xlabel!("Seconds")
ylabel!("Amplitude")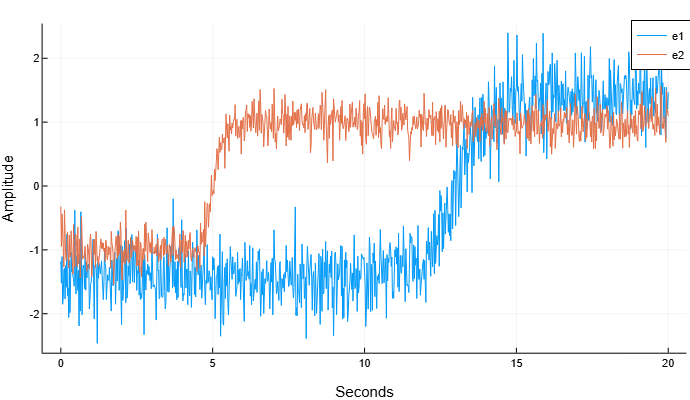
Align the signals so that their transition times match.
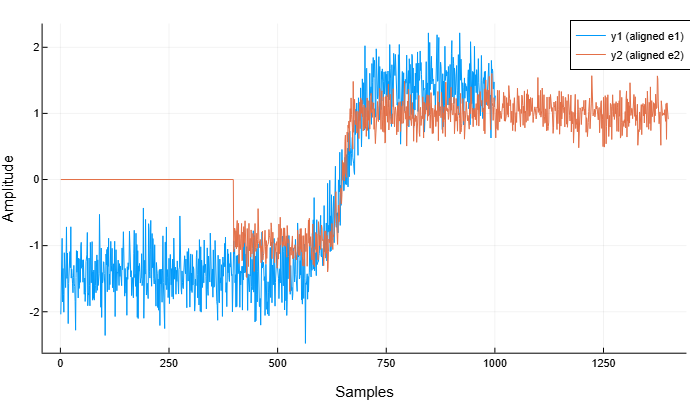
Correlation methods do not allow us to adequately align this type of signals.:
y1, y2 = alignsignals(e1, e2)

plot(y1, label="y1 (aligned e1)")
plot!(y2, label="y2 (aligned e2)")
xlabel!("Samples")
ylabel!("Amplitude")
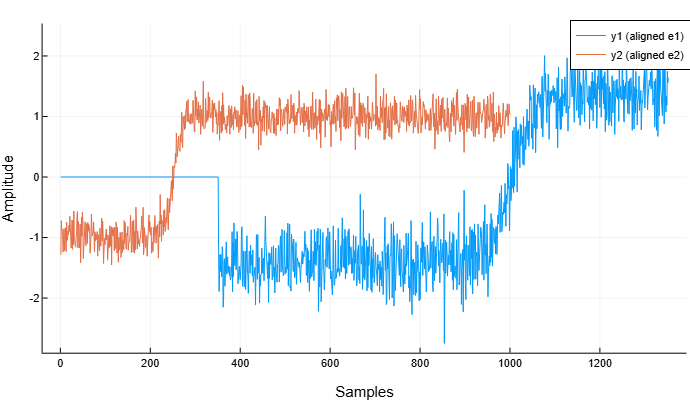
Align the signals using the method "risetime":
y1, y2 = alignsignals(e1, e2, Method="risetime")

plot(y1, label="y1 (aligned e1)")
plot!(y2, label="y2 (aligned e2)")
xlabel!("Samples")
ylabel!("Amplitude")