findpeaks
Finds local maxima.
| Library |
|
Syntax
Function call
-
pks = findpeaks(y)— returns a vector with local maxima (peaks) of the input vectory. A local peak is data samples that are either greater than two adjacent samples or equal toInf. The peaks are displayed in the order they appear. Endpoints of the signal other thanInf, are excluded. If the peak is flat, the function returns only the point with the lowest index.
-
_ = findpeaks(_, Name=Value)— also uses argumentsName=Valuein addition to any input arguments provided in the previous syntaxes.
-
findpeaks(_)— plots the signal without output arguments and imposes peak values.
Arguments
Input arguments
# y — input data
+
vector
Details
Input data set as a vector with real elements. The number of elements in the vector y there must be at least three.
| Data types |
|
# Fs — maximum correlation window size
+
scalar
Details
The sampling rate, set as a positive scalar. The sampling rate is the number of samples per unit of time. If the unit of time is seconds, then the sampling frequency is measured in Hz.
| Data types |
|
Name-value input arguments
Specify optional argument pairs in the format Name=Value, where Name — the name of the argument, and Value — the appropriate value. Type arguments Name=Value they should be placed after the other arguments, but the order of the pairs does not matter.
# Npeaks — maximum number of peaks
+
scalar
Details
The maximum number of peaks to return, set as a positive integer. Function findpeaks it starts from the first element of the input data and shuts down when the number of peaks reaches the value NPeaks.
| Data types |
|
# SortStr — sorting peaks
+
"none" (default) | "ascend" | "descend"
Details
Sorting of peaks, set to one of the following values:
-
"none"— returns peaks in the order they appear in the input data; -
"ascend"— returns peaks in ascending order, from the lowest value to the highest; -
"descend"— returns the peaks in descending order, from the highest value to the lowest.
# MinPeakHeight — minimum peak height
+
-inf (by default) | scalar
Details
The minimum peak height, set as a real scalar. Use this argument to make the function findpeaks returned only peaks exceeding MinPeakHeight. Specifying a minimum peak height can reduce processing time.
| Data types |
|
# MinPeakProminence — minimum peak elevation
+
0 (by default) | scalar
Details
The minimum elevation of the peak, given as a non-negative real scalar. Use this argument to findpeaks returned only those peaks with a relative elevation of at least MinPeakProminence. For more information, see Elevations.
| Data types |
|
# Threshold — minimum height difference
+
0 (by default) | scalar
Details
The minimum height difference between a peak and its neighbors, given as a non-negative real scalar. Use this argument to findpeaks returned only those peaks whose values exceed the values of the nearest neighboring peaks by at least a value Threshold.
| Data types |
|
# MinPeakDistance — minimum distance between peaks
+
0 (by default) | scalar
Details
The minimum distance between peaks, set as a positive real scalar. When specifying the value MinPeakDistance The algorithm selects the highest peak of the signal and ignores all peaks within the distance. MinPeakDistance from him. The function then repeats the procedure for the highest remaining peak and iterates until there are no more peaks to consider.
Use this argument to findpeaks I ignored the small peaks that occur near the larger peak.
| Data types |
|
# WidthReference — reference height for width measurements
+
"halfprom" (by default) | "halfheight"
Details
The reference height for width measurements, set as "halfprom" or "halfheight". Function findpeaks evaluates the peak width as the distance between the points of intersection of the descending signal with the horizontal reference line. The line height is selected using the criteria specified in the argument WidthReference:
-
"halfprom"— places the reference line under the peak at a vertical distance equal to half the height of the peak. For more information, see Elevations; -
"halfheight"— places the reference line at half the height of the peak. The line is truncated if any of its intersection points lie beyond the boundaries of the peaks selected by the argumentsMinPeakHeight,MinPeakProminenceandThreshold. The boundary between the peaks is determined by the horizontal position of the lowest depression between them. Peaks with a height less than zero are discarded.
The position of the intersection points is calculated by linear interpolation.
# MinPeakWidth — maximum peak width
+
0 (by default) | scalar
Details
The minimum peak width, set as a positive real scalar. Use this argument to select only peaks with a width of at least MinPeakWidth.
| Data types |
|
# MaxPeakWidth — maximum peak width
+
Inf (by default) | scalar
Details
The maximum peak width, set as a positive real scalar. Use this argument to select only peaks with a width of no more than MaxPeakWidth.
| Data types |
|
# Annotate — chart style
+
"peaks" (by default) | "extents"
Details
The graph style, set as:
-
"peaks"— plots the signal and annotates the location and value of each peak; -
"extents"— Plots the signal and annotates the location, value, width, and severity of each peak.
This argument is ignored when calling findpeaks with output arguments.
# out — type of output data
+
:plot (by default) | :data
Details
Type of output data:
-
:plot— the function returns a graph; -
:data— the function returns data.
Output arguments
# pks — local maxima
+
vector
Details
Local maxima returned as a vector of signal values. If there are no local maxima, then pks empty.
# locs — peak locations
+
vector
Details
The peak positions returned as a vector.
-
If the location vector is specified
xThenlocscontains valuesxin the peak indexes. -
If the sampling rate is specified
FsThenlocsIt is a numerical vector of time points with a time difference.1/Fsbetween consecutive counts. -
If neither is specified
x, neitherFsThenlocsIt is a vector of integer indexes.
# w is the width of the peaks
+
vector
Details
The peak positions returned as a vector of real numbers. The width of each peak is calculated as the distance between the points to the left and right of the peak where the signal intersects the reference line, the height of which is set by the argument WidthReference. The points themselves are found by linear interpolation.
# p — elevation of peaks
+
vector
Details
The elevations of the peaks returned as a vector of real numbers. The peak elevation is the minimum vertical distance that the signal must descend on both sides of the peak before rising again to a level above the peak or reaching the end point. For more information, see Elevations.
Examples
Finding peaks in the value vector
Details
Let’s create a vector of values and find the peaks in it, build a graph and indicate the peak values on it.
import EngeeDSP.Functions: findpeaks

data = [25, 8, 15, 5, 6, 10, 10, 3, 1, 20, 7]

findpeaks(data)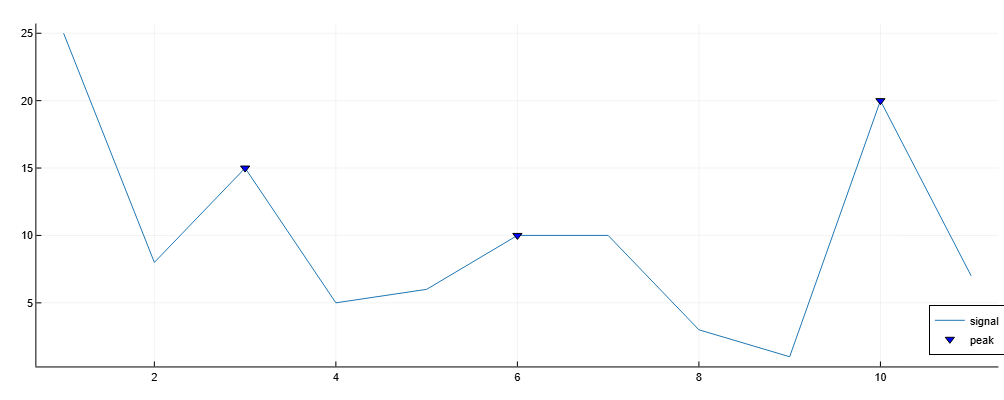
Let’s add the location, value, width, and severity of each peak to the graph.
import EngeeDSP.Functions: findpeaks

data = [25, 8, 15, 5, 6, 10, 10, 3, 1, 20, 7]

findpeaks(data, Annotate="extents")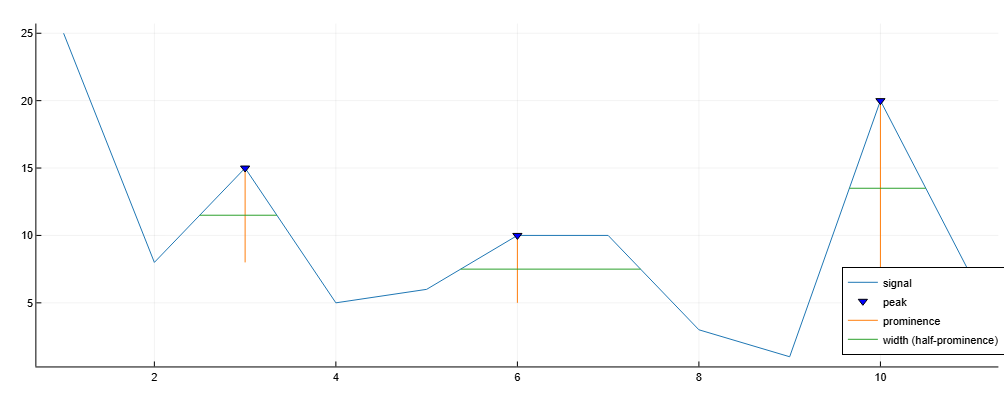
We will only consider peaks with a minimum width. 1.5.
import EngeeDSP.Functions: findpeaks

data = [25, 8, 15, 5, 6, 10, 10, 3, 1, 20, 7]

findpeaks(data, Annotate="extents", MinPeakWidth=1.5)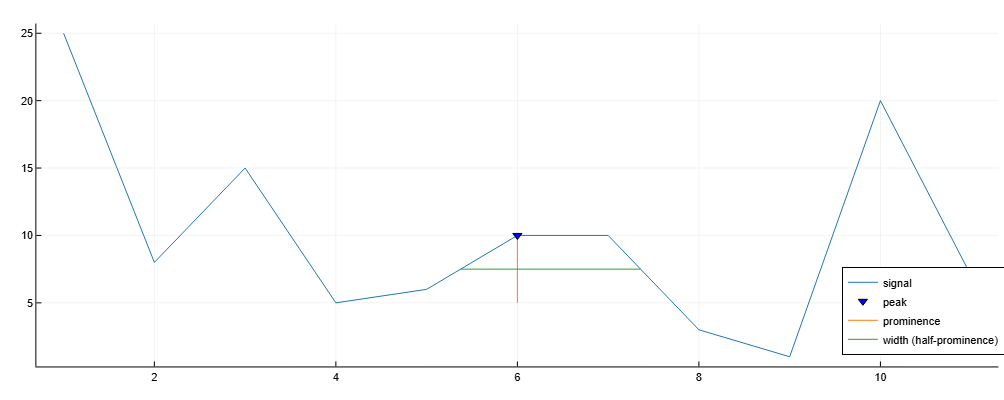
Additional Info
Elevations
Details
The elevation of a peak measures how much it stands out due to its height and location relative to other peaks. A low isolated peak may be more pronounced than the one above, but otherwise does not stand out in any way in the range of high peaks.
To measure the elevation of the peak:
-
Place the marker on the peak.
-
Draw a horizontal line from the peak to the left and right until the line fulfills one of the following conditions:
-
The signal will cross because there is a higher peak.;
-
It will reach the left or right end of the signal.
-
-
Find the minimum of the signal in each of the two intervals defined in step 2. This point is either the trough or one of the endpoints of the signal.
-
The higher of the two minima of the interval determines the reference level. The height of the peak above this level is its elevation.
Function findpeaks It makes no assumptions about the behavior of the signal beyond its endpoints, regardless of their height. As a result, steps 2 and 4 do not take into account the behavior of the signal beyond the endpoints, which often affects the value of the reference level. Consider, for example, the peaks of this signal:

| Peak number | The left interval lies between the peak and … | The right interval lies between the peak and … | The lowest point on the left interval | The lowest point on the right interval | The starting point level (maximum minimum) |
|---|---|---|---|---|---|
1 |
The left end |
Intersection due to peak 2 |
The left endpoint |
a |
a |
2 |
The left end |
The right end |
The left endpoint |
h |
The left endpoint |
3 |
Intersection due to peak 2 |
Intersection due to peak 4 |
b |
c |
c |
4 |
Intersection due to peak 2 |
Intersection due to peak 6 |
b |
d |
b |
5 |
Intersection due to peak 4 |
Intersection due to peak 6 |
d |
e |
e |
6 |
Intersection due to peak 2 |
The right end |
d |
h |
d |
7 |
Intersection due to peak 6 |
Intersection due to peak 8 |
f |
g |
g |
8 |
Intersection due to peak 6 |
The right end |
f |
h |
f |
9 |
Intersection due to peak 6 |
Intersection due to the right endpoint |
h |
i |
i |