findsignal
Finds the location of the signal using a similarity search.
| Library |
|
Syntax
Function call
-
istart, istop, dist = findsignal(data, signal)— returns the start and end indexes of a segment of the data arraydata, which best matches the search arraysignal. The segment for which the square of the Euclidean distance between the segment and the search array is considered the best match.distis the smallest. Ifdataandsignal— matrices, thenfindsignalfinds the start and end columns of the arraydata, which best matchessignal. In this casedataandsignalthey must have the same number of rows.
-
istart, istop, dist = findsignal(data, signal, Name,Value)— uses additional parameters specified by one or more argumentsName,Value. The parameters include the normalization applied, the number of segments for the report, and the distance metric used.
Arguments
Input arguments
# data — an array of data
+
vector | the matrix
Details
An array of data specified as a vector or matrix.
| Data types |
|
| Support for complex numbers |
Yes |
# signal — search array
+
vector | the matrix
Details
A search array specified as a vector or matrix.
| Data types |
|
| Support for complex numbers |
Yes |
Name-value input arguments
Specify optional argument pairs in the format Name, Value, where Name — the name of the argument, and Value — the appropriate value. Name-value arguments should be placed after other arguments, but the order of the pairs does not matter.
Use commas to separate the name and value, and Name put it in quotation marks.
Example: findsignal([10,12,3,4], [10.3,12.3], "MaxDistance", 0.2).
# Normalization — normalization statistics
+
"none" (by default)
Details
Normalization statistics. In the current implementation, only the mode is available "none" — do not normalize.
# NormalizationLength — normalization length
+
scalar
Details
The normalization length, set as an integer scalar. This value represents the minimum number of samples by which each sample is normalized in both the data and the signal. If the signal is a matrix, then NormalizationLength represents the number of columns.
| Data types |
|
# MaxDistance — maximum distance
+
Inf (by default) | scalar
# TimeAlignment — time alignment method
+
"fixed" (by default) | "dtw"
Details
The time alignment method:
-
"fixed"— do not stretch or repeat the counts to minimize the distance; -
"dtw"— an attempt to shorten the distance by stretching the time axis and repeating the counts either in the data or in the signal.
# Metric — distance metric
+
"squared" (default) | "absolute" | "euclidean" | "symmkl"
Details
The distance metric set as one of the values: "squared", "absolute", "euclidean" or "symmkl". If and are -measured signals, then the metric sets — the distance between -m countdown and -m countdown .
-
"squared"— the square of the Euclidean metric, consisting of the sum of the squares of the differences: -
"euclidean"— the root of the sum of the squares of the differences, also known as the Euclidean metric or : -
"absolute"— the sum of absolute differences, also known as the distance of city blocks, the Manhattan metric, the taxi metric, or : -
"symmkl"— symmetric Kullback—Leibler metric. This metric is only true for real and positive numbers. and :
Output arguments
# istart, istop — start and end indexes of the segment
+
scalar | vector
Details
The start and end indexes of the segment, returned as an integer scalar or vector.
# dist — minimum distance between data and signal
+
scalar | vector
Details
The minimum distance between the data and the signal, returned as a scalar or vector.
Examples
Finding a signal in the data
Details
We will generate a data set consisting of a Gaussian pulse with a frequency of 5 Hz with bandwidth 50%, sampled for half a second with a frequency of 1 kHz. Let’s create a signal consisting of one and a half periods of a sine wave with a frequency of 10 Hz. Let’s plot the data set and the signal.
import EngeeDSP.Functions: findsignal
import EngeeDSP.Functions: gauspuls

fs = 1e3

t = 0:1/fs:0.5
ts = 0:1/fs:0.15

data_result = gauspuls(t, 5, 0.5)
data = data_result.yc

signal = cos.(2π * 10 * ts)

p1 = plot(t, data, title="Data", legend=false)
p2 = plot(ts, signal, title="Signal", legend=false)

plot(p1, p2, layout=(2,1))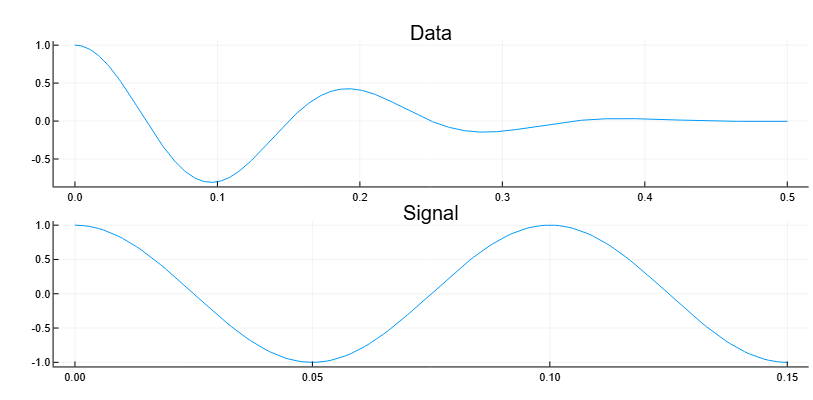
Let’s find the data segment with the smallest square of the Euclidean distance to the signal. Let’s plot the data graph and highlight this segment.
result = findsignal(data, signal)

plot(t, data, label="Data", linewidth=2)
plot!(t[result[1]:result[1]+length(signal)-1], data[result[1]:result[1]+length(signal)-1],
      label="Signal", linewidth=3)
title!("Signal Matches Found")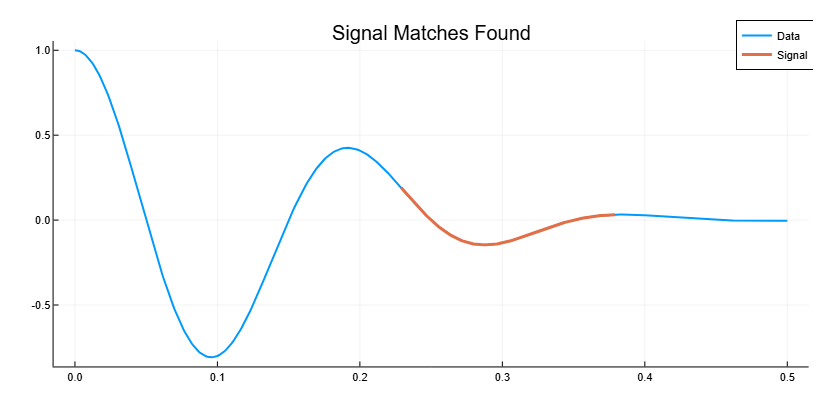
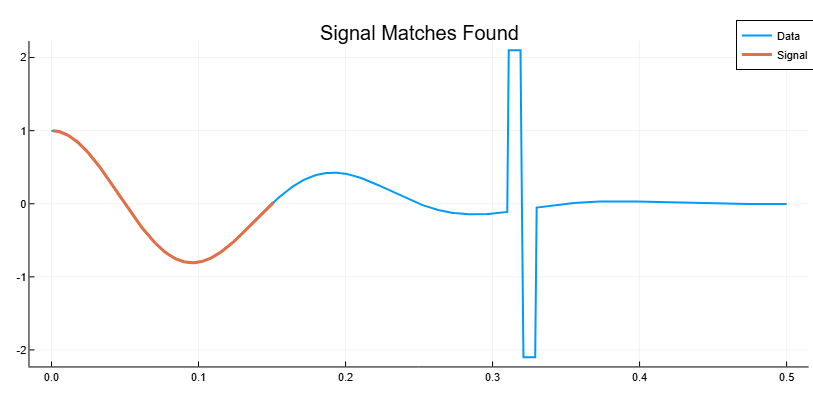
Let’s add two clearly missing sections to the dataset. Let’s find the segment that is closest to the signal (in terms of the smallest absolute distance). Let’s plot the data graph and highlight this segment.
dt = data
dt[(t .> 0.31) .& (t .< 0.32)] .= 2.1
dt[(t .> 0.32) .& (t .< 0.33)] .= -2.1

result = findsignal(dt,signal,"Metric","absolute")

plot(t, data, label="Data", linewidth=2)
plot!(t[result[1]:result[1]+length(signal)-1], data[result[1]:result[1]+length(signal)-1],
      label="Signal", linewidth=3)
title!("Signal Matches Found")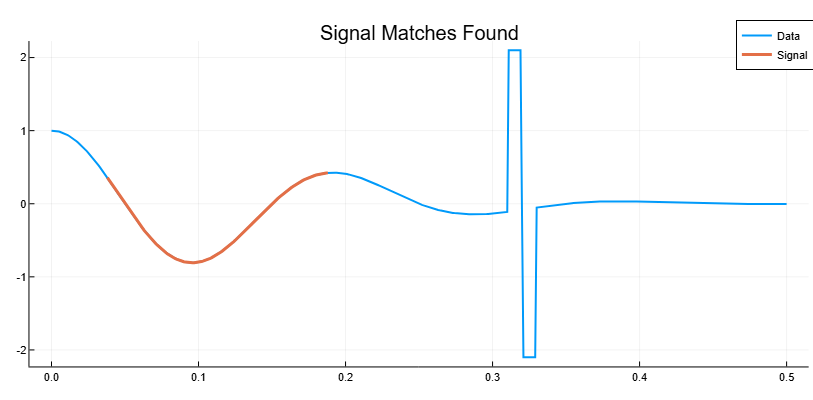
Let the axis x it is stretched if the stretching results in a smaller absolute distance between the nearest data segment and the signal.
result = findsignal(dt,signal,"TimeAlignment", "dtw", "Metric","absolute")

plot(t, data, label="Data", linewidth=2)
plot!(t[result[1]:result[1]+length(signal)-1], data[result[1]:result[1]+length(signal)-1],
      label="Signal", linewidth=3)
title!("Signal Matches Found")