medfreq
The median frequency.
| Library |
|
Syntax
Function call
-
freq, power = medfreq(_,freqRange)— also uses the frequency rangefreqRange, on which the median frequency is calculated. This syntax can include any combination of input arguments from the previous syntaxes, provided that the second input argument is eitherFsorf. If the second input argument is passed empty, thenmedfrequses a normalized frequency. The default value forfreqRange— the entire bandwidth of the input signal.
-
medfreq(_,out=:plot)— Plots the power spectral density or power spectrum and annotates the calculated median frequency.
Arguments
Input arguments
# x — input signal
+
vector | the matrix
Details
An input signal specified as a vector or matrix. If x — vector, then medfreq processes it as a single channel. If x is a matrix, then the function calculates the median frequency independently for each column x.
| Data types |
|
#
Fs —
sampling
rate
positive real scalar
Details
The sampling frequency, set as a positive real scalar. The sampling rate is the number of samples per unit of time. If the unit of time is seconds, then the sampling frequency is indicated in Hz.
| Data types |
|
# pxx — spectral power density
+
vector | the matrix
Details
The spectral power density, defined as a vector or matrix. If pxx — the matrix, then medfreq calculates the median frequency independently for each column pxx.
The power spectral density should be expressed in linear units, not in dB.
| Data types |
|
# sxx — spectral power estimation
+
vector | the matrix
Details
Spectral power estimate, specified as a vector or matrix. If sxx — the matrix, then medfreq calculates the median frequency independently for each column sxx.
The power spectral density should be expressed in linear units, not in dB.
| Data types |
|
# rbw — frequency resolution
+
positive scalar
Details
Frequency resolution, set as a positive scalar. The frequency resolution is defined as the product of two quantities: the frequency resolution of the discrete Fourier transform and the equivalent bandwidth of the window noise used to calculate the power spectral density.
| Data types |
|
# freqRange — frequency range
+
two-element vector
Details
The frequency range specified as a two-element vector of real values. If freqRange not specified, then medfreq uses the full bandwidth of the input signal.
| Data types |
|
Output arguments
# power — spectral power in the frequency band
+
scalar | vector
Details
The spectral power in the frequency band, returned as a scalar or vector.
Examples
The median frequency of the chirp signal
Details
Generate 1024 sampling rate of the chirp signal 1024 kHz. Let’s set the chirp frequency so that it starts with 50 kHz and reached 100 kHz at the end of the signal. Add white Gaussian noise so that the signal-to-noise ratio is 40 dB. Restart the random number generator to get reproducible results.
import EngeeDSP.Functions: medfreq, chirp, std
using Random

nSamp = 1024
Fs = 1024e3
SNR = 40
Random.seed!(0)
t = (0:nSamp-1)./ Fs
x = chirp(t, 50e3, nSamp/Fs, 100e3)
x = x.+ randn(nSamp).* std(x)[1]./(10^(SNR/20))
Let’s estimate the median frequency of the chirp signal. Let’s plot the power spectral density and determine the median frequency.
medfreq(x,Fs,out=:plot)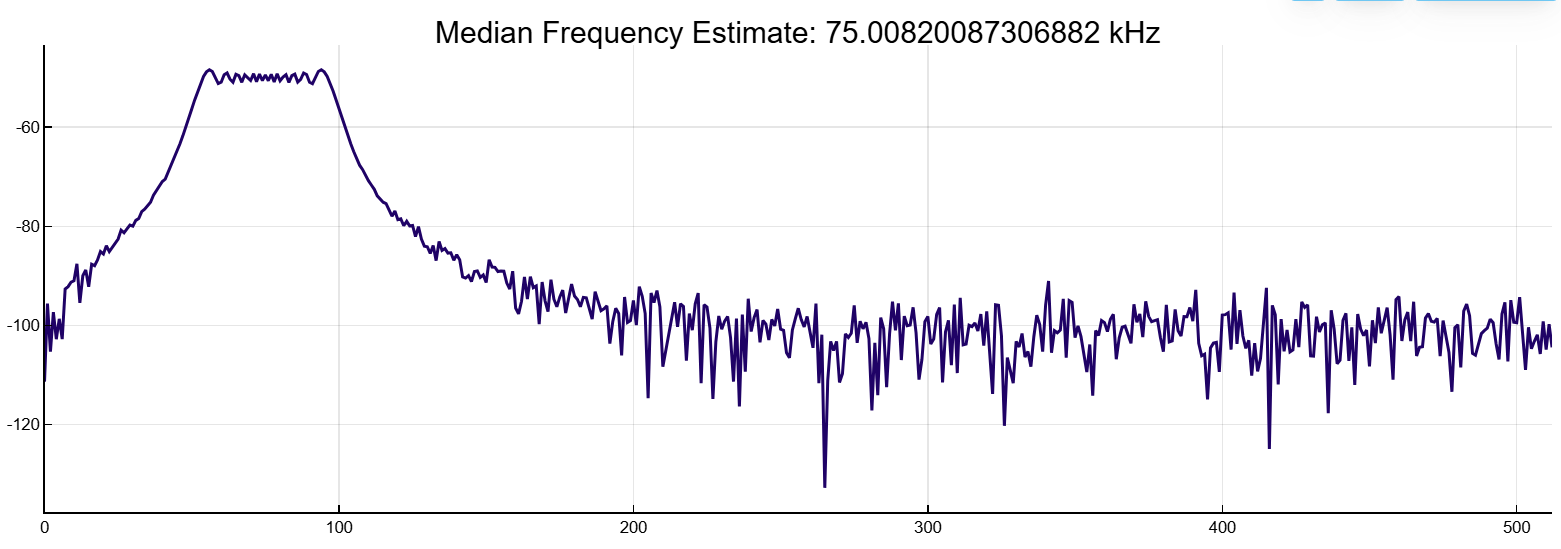
We will generate another chirp signal. Setting the initial frequency 200 kHz, the final frequency 300 kHz and an amplitude twice the amplitude of the first signal. Add white Gaussian noise.
x2 = 2*chirp(t,200e3,nSamp/Fs,300e3)
x2 = x2.+ randn(nSamp).* std(x2)[1]./(10^(SNR/20))
Combine the chirp signals to produce a two-channel signal. Let’s estimate the median frequency of each channel.
y = medfreq([x x2],Fs)([75008.20087306881, 249993.82312082333], [0.4996644951191848, 1.9996231821604598])Let’s plot the spectral power density of the two channels.
y = medfreq([x x2],Fs,out=:plot)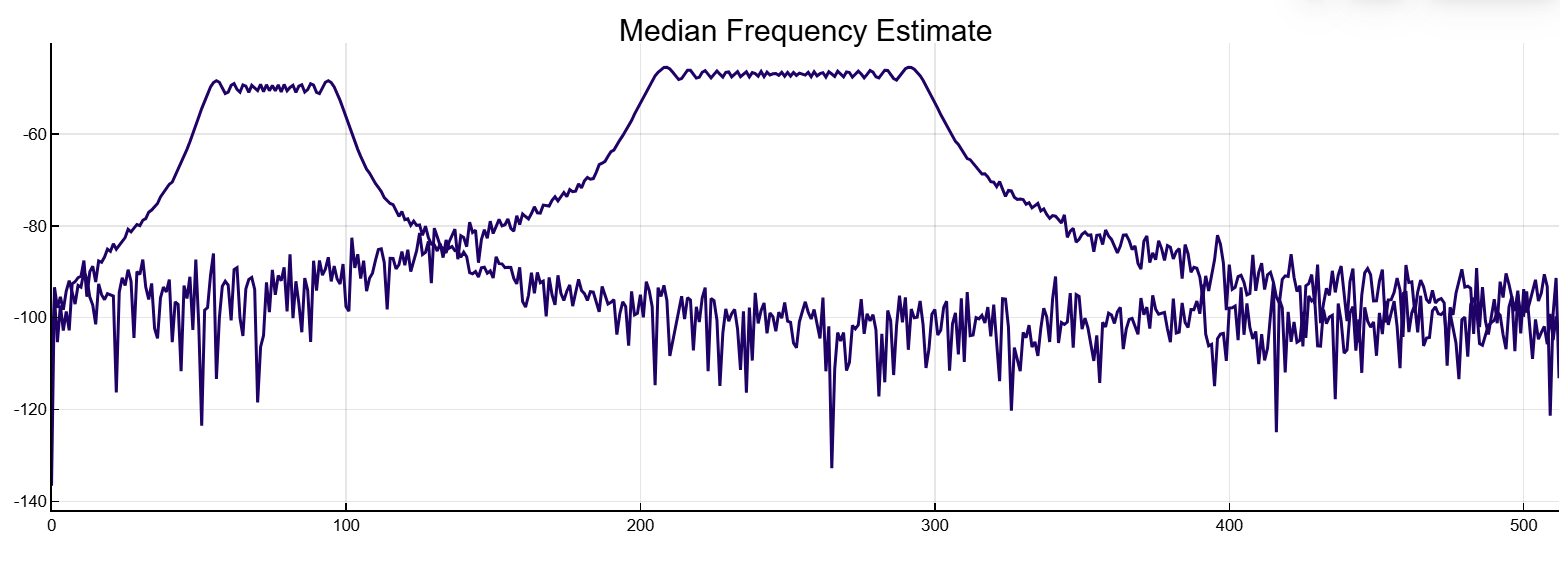
Add up the two channels to form a new signal. Let’s plot the power spectral density and determine the median frequency.
y = medfreq(x+x2,Fs,out=:plot)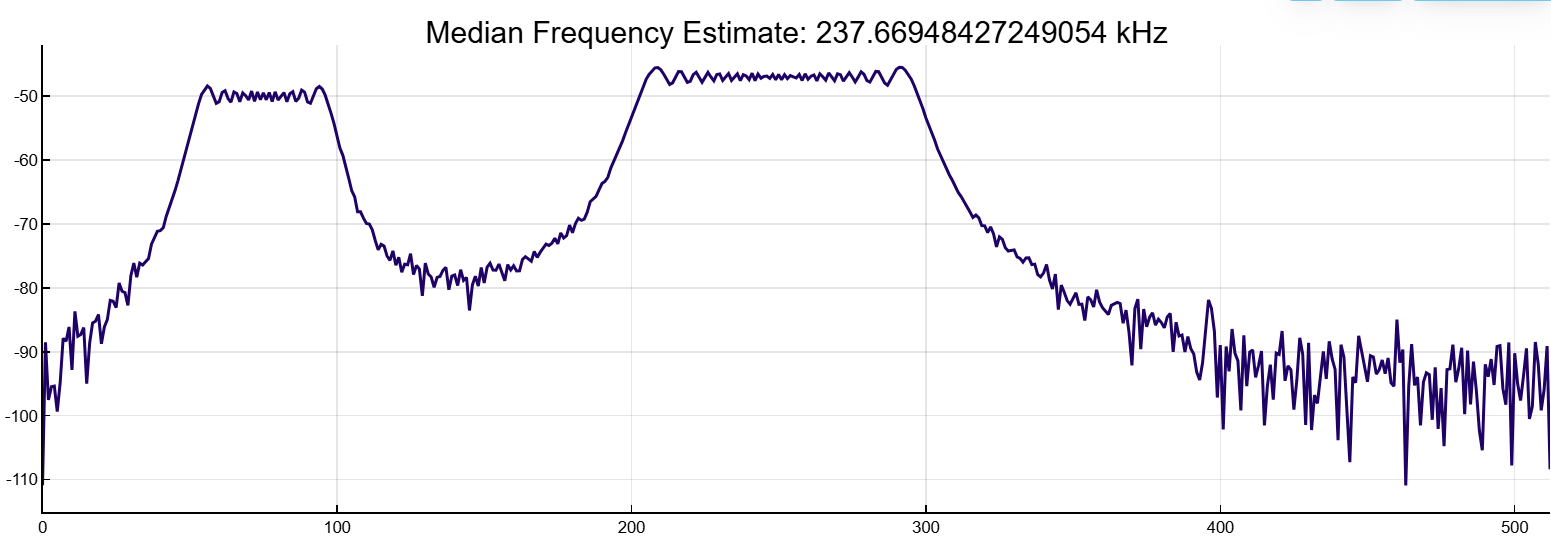
The median frequency of the sine wave
Details
Generate 1024 sampling of a sinusoidal signal with a frequency 100.123 kHz, sampled with frequency 1024 kHz. Add white Gaussian noise so that the signal-to-noise ratio is 40 dB. Restart the random number generator to get reproducible results.
import EngeeDSP.Functions: medfreq, sin, std
using Random

nSamp = 1024
Fs = 1024e3
SNR = 40
Random.seed!(0)
t = (0:nSamp-1)./ Fs
x = sin.(2π * t * 100.123e3)
x = x.+ randn(nSamp).* std(x)[1]./(10^(SNR/20))
Let’s estimate the median frequency of the sinusoidal signal. Let’s plot the power spectral density and determine the median frequency.
medfreq(x,Fs,out=:plot)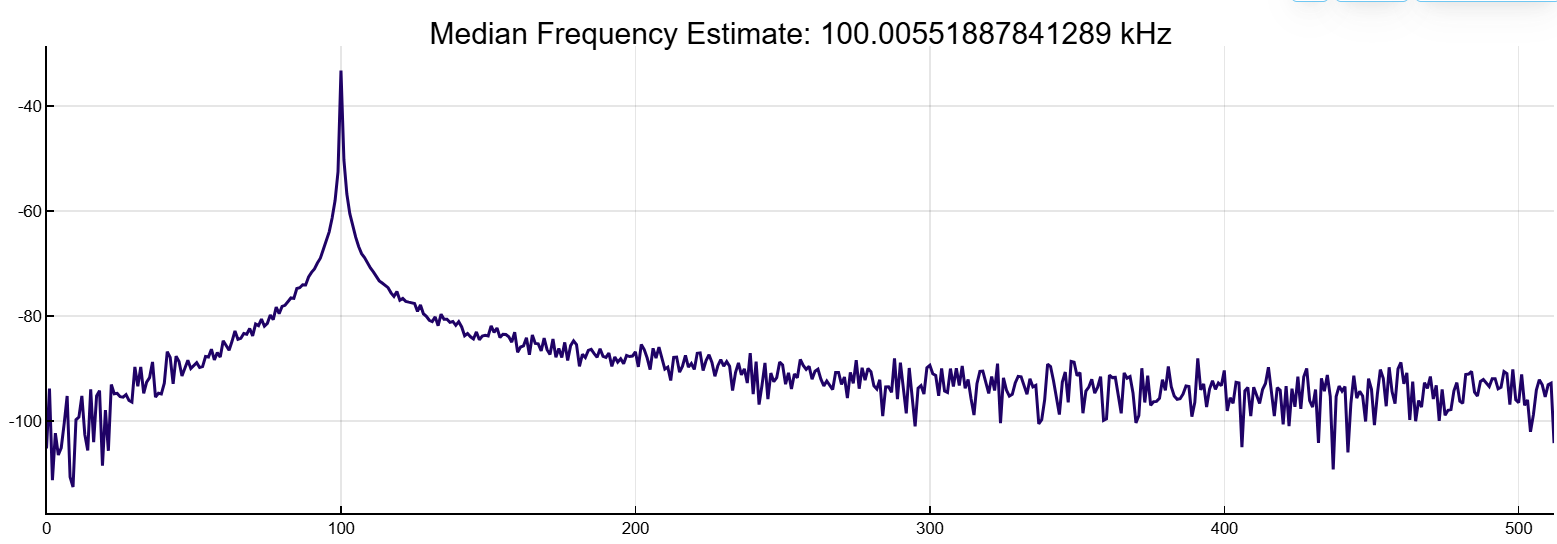
We will generate another sinusoidal signal with a frequency of 257.321 kHz and an amplitude twice the amplitude of the first sine wave. Add white noise.
x2 = sin.(2π * t * 257.321e3)
x2 = x2.+ randn(nSamp).* std(x2)[1]./(10^(SNR/20))
Combine the sinusoids to produce a two-channel signal. Let’s estimate the median frequency of each channel.
y = medfreq([x x2],Fs)([100005.51887841288, 257099.81517133984], [0.49964321557716784, 0.4998751983807168])Let’s plot the spectral power density of the two channels.
y = medfreq([x x2],Fs,out=:plot)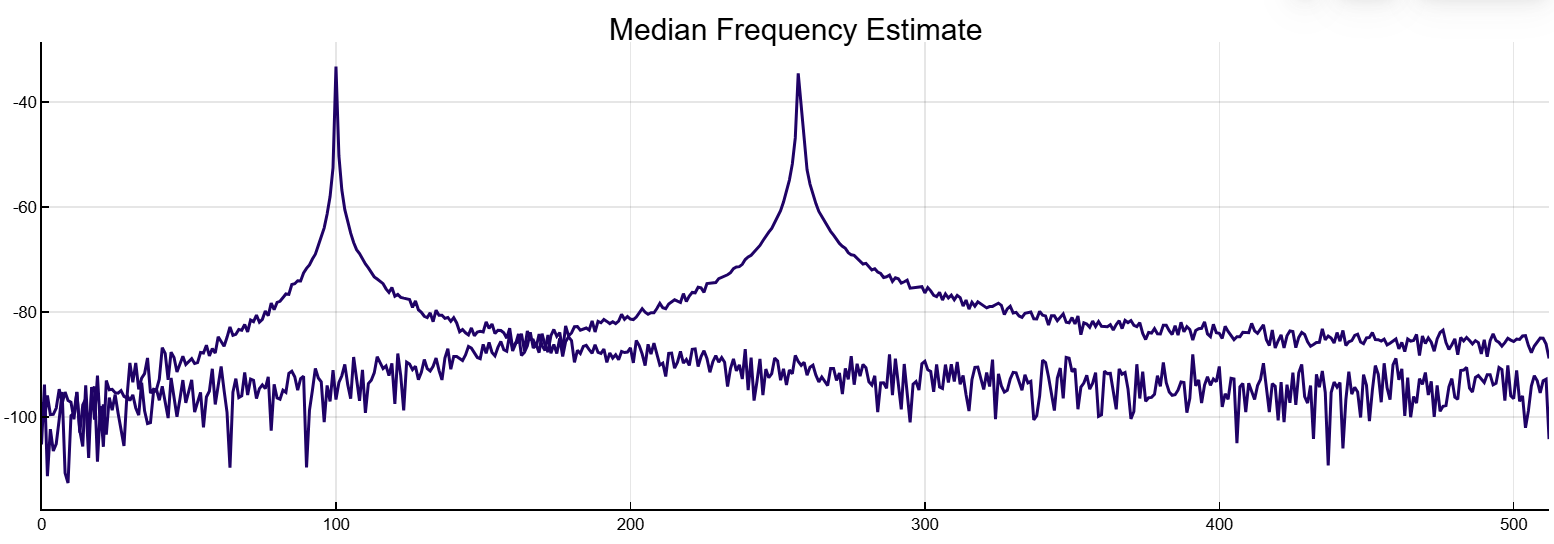
Add up the two channels to form a new signal. Let’s plot the power spectral density and determine the median frequency.
y = medfreq(x+x2,Fs,out=:plot)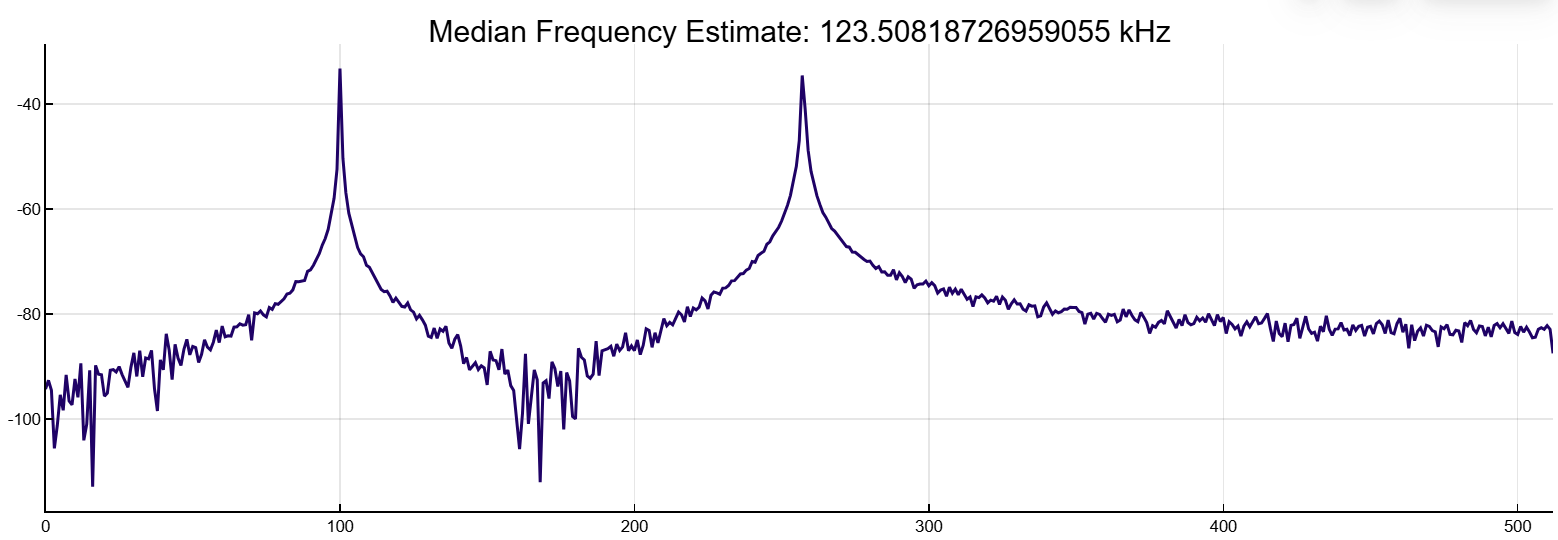
Median frequency of band-limited signals
Details
Let’s create a signal whose spectral power density resembles the frequency response of a bandpass FIR filter. 88-th order with normalized cutoff frequencies.
import EngeeDSP.Functions: fir1, medfreq, bandpower

d = fir1(88,[0.25 0.45])

medfreq(d,[],[0.3 0.6]*pi, out=:plot)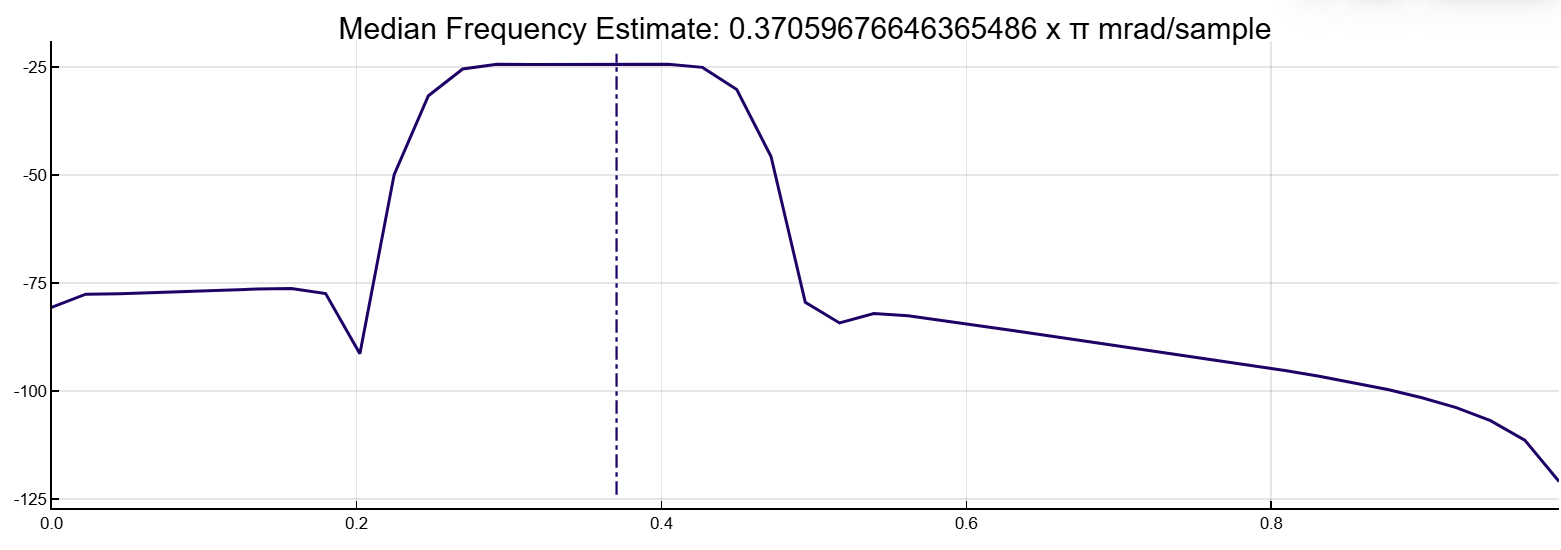
We will output the median frequency and power for the measurement interval. Specifying the sampling rate 2π it is equivalent to the fact that the sampling frequency is not set.
mf=medfreq(d,[],[0.3 0.6]*pi)
println("Median = $(round(mf[1]/pi, digits=3))*pi, power = $(round(mf[2]/bandpower(d)*100, digits=1))% of total")
Median = 0.371*pi, power = 77.4% of totalAdd a second channel with normalized cutoff frequencies 0.5π rad/countdown and 0.8π rad/count and an amplitude of one tenth of the amplitude of the first channel.
d2=fir1(88,[0.5 0.8])/10
medfreq([d d2],[],[0.3 0.9]*pi, out=:plot)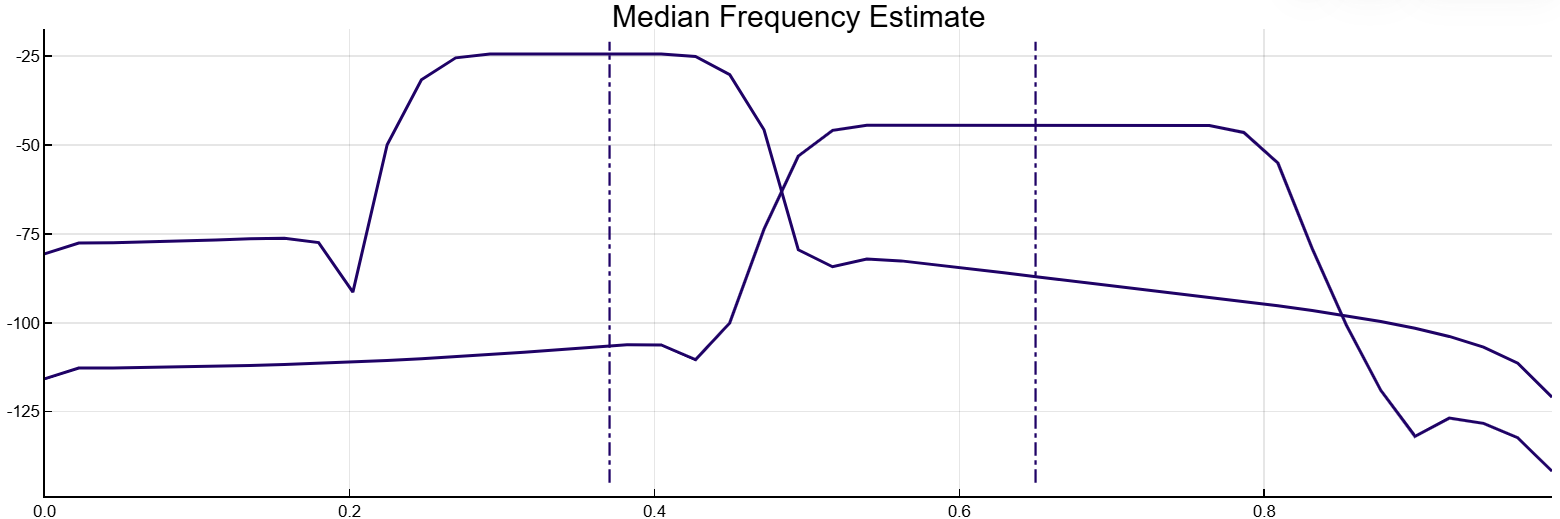
Let’s output the median frequency of each channel. Divide by π.
mf=medfreq([d d2],[],[0.3 0.9]*pi)
println(mf[1]/pi)
[0.370596807684655, 0.6500040234987472]Algorithms
Details
To determine the median frequency medfreq calculates an estimate of the periodogram’s power spectrum using a rectangular window.
The same value of the median frequency medFrq can be obtained from the signal x with sampling rate Fs in three ways.
| Directly from the signal |
|
| According to the periodogram of the signal |
|
| Based on an estimate of the spectral power of the signal (spectral Welch power density) |
|
Because medfreq It uses an intermediate representation to convert the input signal from the time domain to the frequency domain. The median frequency returned may vary depending on the signal conversion method, the number of DFT points, and the window size.
|
Literature
-
Phinyomark, Angkoon, Sirinee Thongpanja, Huosheng Hu, Pornchai Phukpattaranont, and Chusak Limsakul, The Usefulness of Mean and Median Frequencies in Electromyography Analysis, Computational Intelligence in Electromyography Analysis — A Perspective on Current Applications and Future Challenges, edited by Ganesh R. Naik. London: IntechOpen, 2012. https://doi.org/10.5772/50639.