slewrate
The rate of rise of a two-level signal.
| Library |
|
Syntax
Function call
-
s = slewrate(x)— returns the rate of rise for all transitions found in the two-level signalx. To determine transitions, the functionslewrateevaluates the state levels of the input signal using the histogram method and identifies all areas crossing the upper boundary of the lower state and the lower boundary of the upper state.
-
s,lt,ut = slewrate(___)— returns the time points when the signal crosses the lower percentage reference levelltand the upper percentage reference levelut. If the lower and upper percentage reference levels are not specified, the default values are10% and90%, respectively. You can specify an input combination of any of the above syntax options.
-
s = slewrate(___,Name,Value)— returns the rate of increase for all transitions with additional arguments specified by one or more arguments of the typeName,Value.
-
slewrate(___)— plots a two-level signal and darkens the areas of each transition where the rate of rise is calculated. The graph shows the intersections of the lower and upper reference levels, as well as the corresponding reference levels. The graph also shows the state levels and their corresponding lower and upper tolerances.
Arguments
Input arguments
# x is a two— level signal
+
the real vector
Details
A two-level signal defined as a real vector. If the input signal does not have at least one transition, the function returns an empty matrix. The first moment in time in x respond .
#
Fs —
sampling
rate
positive real scalar
Details
The sampling frequency, specified as a positive real scalar, expressed in hertz.
Name-value input arguments
Specify optional argument pairs as Name,Value, where Name — the name of the argument, and Value — the appropriate value. Name-value arguments should be placed after other arguments, but the order of the pairs does not matter.
Use commas to separate the name and value, and Name put it in quotation marks.
# PercentReferenceLevels — percentage reference levels
+
[10,90] (by default) | the real vector
Details
Percentage reference levels, defined as a real vector of size 1 on 2. For more information, see [percentage-reference-levels].
# StateLevels — lower and upper state levels
+
the real vector
Details
The levels of the lower and upper states, defined as a real vector of size 1 on 2. The first element is the lower state level. The second element is the upper state level. If the parameter StateLevels not specified, the function evaluates the state levels based on the input signal using the histogram method.
# Tolerance — tolerance levels
+
2 (by default) | scalar
Details
Tolerance levels (the boundaries of the lower and upper states), set as a scalar, expressed as a percentage. The boundaries of the lower and upper states are expressed as the state level plus or minus a multiple of the difference between the state levels. For more information, see State-level tolerances.
# out — type of output data
+
:plot (by default) | :data
Details
Type of output data:
-
:plot— the function returns a graph; -
:data— the function returns data.
Output arguments
# s — rate of increase
+
vector
Details
The rate of increase returned as a vector. A positive rate of increase indicates that the upper percentage reference level occurs later than the lower percentage reference level. A negative rate of increase indicates that the upper percentage reference level occurs earlier than the lower percentage reference level. The rate of rise is the slope of the line connecting 10% and 90% reference levels.
# lt — time points when the input signal crosses the lower percentage reference level
+
vector
Details
The time points when the input signal crosses the lower percentage reference level, returned as a vector.
# ut — time points when the input signal crosses the upper percentage reference level
+
vector
Details
The time points when the input signal crosses the upper percentage reference level, returned as a vector.
# ll — signal values at the lower reference level
+
vector
Details
The signal values at the lower percentage reference level, returned as a vector.
# ul — signal values at the upper reference level
+
vector
Details
The signal values at the upper percentage reference level, returned as a vector.
Examples
The rate of rise for a single-transition signal
Details
Using the function slewrate without output arguments for displaying information about the rate of rise of a step signal with a sampling frequency 4 MHz.
Let’s display the rate of increase on the signal graph.
t = [0, 2.5000e-07, 5.0000e-07, 7.5000e-07, 1.0000e-06, 1.2500e-06, 1.5000e-06, 1.7500e-06, 2.0000e-06, 2.2500e-06, 2.5000e-06, 2.7500e-06, 3.0000e-06,
     3.2500e-06, 3.5000e-06, 3.7500e-06, 4.0000e-06, 4.2500e-06, 4.5000e-06, 4.7500e-06, 5.0000e-06, 5.2500e-06, 5.5000e-06, 5.7500e-06, 6.0000e-06,
     6.2500e-06, 6.5000e-06, 6.7500e-06, 7.0000e-06, 7.2500e-06, 7.5000e-06, 7.7500e-06, 8.0000e-06, 8.2500e-06, 8.5000e-06, 8.7500e-06, 9.0000e-06,
     9.2500e-06, 9.5000e-06, 9.7500e-06]

x = [0, 0.0113, 0.0375, -0.0503, 0.0238, 0.0029, -0.0269, -0.0067, 0.0068, 0.0743, 0.0520, -0.0302, 0.0682, 0.0083, 3.9817e-04, 0.0153, -0.0056,
     -0.0016, 0.0312, 0.1020, -0.1500, 2.4276, 2.1826, 2.3297, 2.3275, 2.3090, 2.3219, 2.3137, 2.2932, 2.3072, 2.2826, 2.3204, 2.2735, 2.2806, 2.2837,
     2.2389, 2.3349, 2.3017, 2.2852, 2.3301]

import EngeeDSP.Functions: slewrate
slewrate(x, t, out=:plot)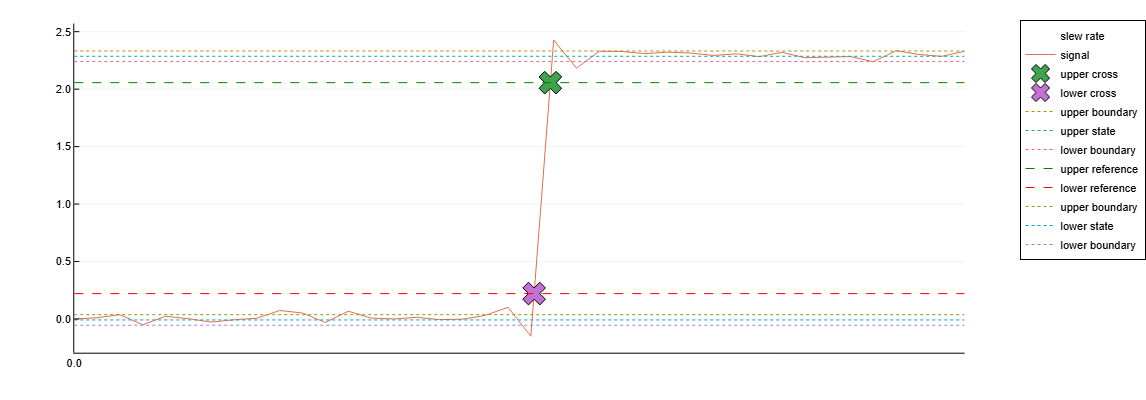
The rate of rise for a signal with two transitions
Details
Let’s create a two-level signal with two transitions, one positive and one negative. The sampling rate is 4 MHz. We obtain the values of the rate of increase for the two transitions.
fs = 4e6

x = [0, 0.0113, 0.0375, -0.0503, 0.0238, 0.0029, -0.0269, -0.0067, 0.0068, 0.0743, 0.0520, -0.0302, 0.0682, 0.0083, 3.9817e-04, 0.0153, -0.0056,
     -0.0016, 0.0312, 0.1020, -0.1500, 2.4276, 2.1826, 2.3297, 2.3275, 2.3090, 2.3219, 2.3137, 2.2932, 2.3072, 2.2826, 2.3204, 2.2735, 2.2806, 2.2837,
     2.2389, 2.3349, 2.3017, 2.2852, 2.3301]

y = [x; reverse(x)]
t = (0:length(y)-1)/fs

import EngeeDSP.Functions: slewrate
s = slewrate(y, t)
([1.0310400000000061e7, -1.0310399999999963e7], [5.0360000000000006e-6, 1.4714e-5], [5.2139999999999995e-6, 1.4536e-5], 0.22117440000000002, 2.0564256000000003)Let’s display the rate of increase on the signal graph.
slewrate(y, t, out=:plot)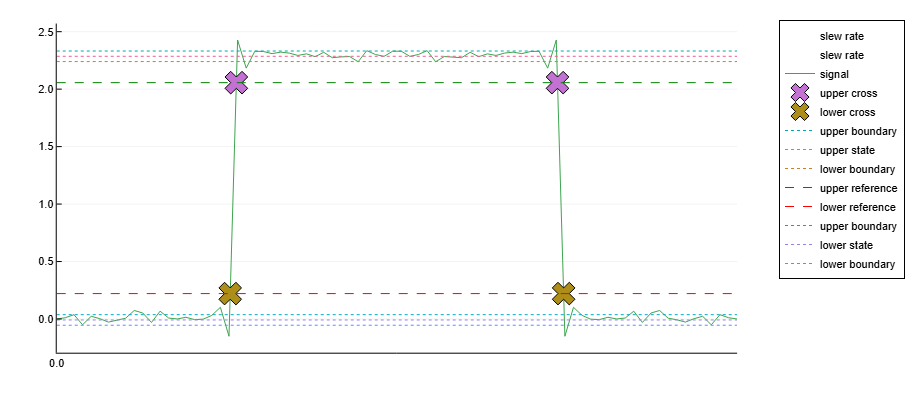
Lower and upper transition time
Details
We get the time of the lower and upper transitions for a signal with two transitions and with a sampling frequency 4 MHz.
fs = 4e6

x = [0, 0.0113, 0.0375, -0.0503, 0.0238, 0.0029, -0.0269, -0.0067, 0.0068, 0.0743, 0.0520, -0.0302, 0.0682, 0.0083, 3.9817e-04, 0.0153, -0.0056,
     -0.0016, 0.0312, 0.1020, -0.1500, 2.4276, 2.1826, 2.3297, 2.3275, 2.3090, 2.3219, 2.3137, 2.2932, 2.3072, 2.2826, 2.3204, 2.2735, 2.2806, 2.2837,
     2.2389, 2.3349, 2.3017, 2.2852, 2.3301]

y = [x; reverse(x)]
t = (0:length(y)-1)/fs

import EngeeDSP.Functions: slewrate
s, lt, ut = slewrate(y, t)
println("lt = ", lt)
println("ut = ", ut)
lt = [5.0360000000000006e-6, 1.4714e-5]
ut = [5.2139999999999995e-6, 1.4536e-5]Let’s repeat the calculation using the sampling frequency instead of the vector of time points.
s, lt, ut = slewrate(y, fs)
println("lt = ", lt)
println("ut = ", ut)
lt = [5.0360000000000006e-6, 1.4714e-5]
ut = [5.2139999999999995e-6, 1.4536e-5]Let’s display the rate of increase on the signal graph.
slewrate(y, fs, out=:plot)
Lower and upper reference levels
Details
We obtain the signal values corresponding to the lower and upper reference levels for a signal with two transitions and a sampling frequency. 4 MHz. Let’s calculate these values for the default levels. 10% and 90%.
fs = 4e6

x = [0, 0.0113, 0.0375, -0.0503, 0.0238, 0.0029, -0.0269, -0.0067, 0.0068, 0.0743, 0.0520, -0.0302, 0.0682, 0.0083, 3.9817e-04, 0.0153, -0.0056,
     -0.0016, 0.0312, 0.1020, -0.1500, 2.4276, 2.1826, 2.3297, 2.3275, 2.3090, 2.3219, 2.3137, 2.2932, 2.3072, 2.2826, 2.3204, 2.2735, 2.2806, 2.2837,
     2.2389, 2.3349, 2.3017, 2.2852, 2.3301]

y = [x; reverse(x)]
t = (0:length(y)-1)/fs

import EngeeDSP.Functions: slewrate
s, lt, ut, ll, ul = slewrate(y, t);
println("ll = ", ll)
println("ul = ", ul)
ll = 0.22117440000000002
ul = 2.0564256000000003Let’s repeat the calculation for reference levels equal to 20% and 80%. Let’s display the rate of increase on the signal graph.
slewrate(y, t, "PercentReferenceLevels", [20 80], out=:plot)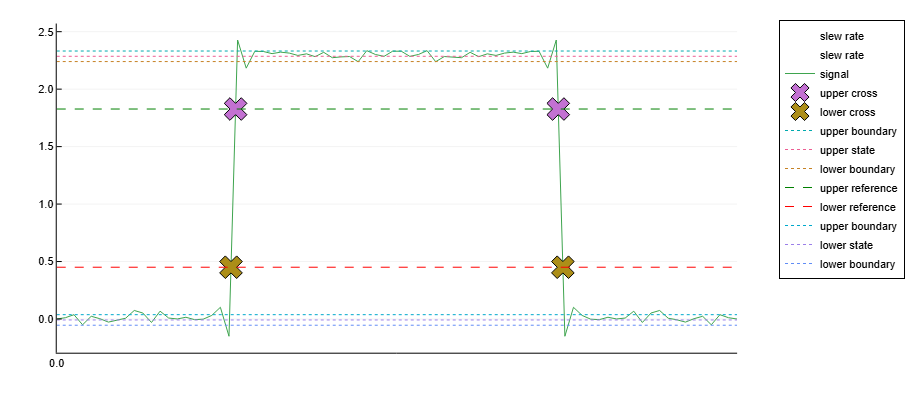
Additional Info
Percentage reference levels
Details
If — this is the lower state, — top condition, eh — the upper percentage reference level, then the signal value corresponding to the upper percentage reference level is
If — the lower percentage reference level, then the signal value corresponding to the lower percentage reference level is
The rate of increase
Details
The rate of increase is the slope of the line connecting the upper and lower percentage reference levels. Let indicates the time when the signal crosses the lower percentage reference level, and — the time when the signal crosses the upper percentage reference level. Using the definitions of the upper and lower percentage reference levels given in the [percentage-reference-levels] section, we determine the rate of increase:
If comes earlier , the rate of increase is positive. If comes earlier , the rate of increase is negative.
State-level tolerances
Details
You can specify the boundaries of the lower and upper states for each state level. Define boundaries as the level of states plus or minus a scalar value that is a multiple of the difference between the upper and lower states. To set a useful tolerance range, specify a scalar value as a small number, for example or . In the general case, the area for the lower state, it is defined as
where — the level of the lower state, and — the level of the upper state. Replace the first term in the equation with to get the tolerance area for the upper state level.