barplot
|
The page is in the process of being translated. |
#
Makie.barplot — Function
barplot(positions, heights; kwargs...)Plots a barplot.
Plot type
The plot type alias for the barplot function is BarPlot.
Examples
using CairoMakie
f = Figure()
Axis(f[1, 1])

xs = 1:0.2:10
ys = 0.5 .* sin.(xs)

barplot!(xs, ys, color = :red, strokecolor = :black, strokewidth = 1)
barplot!(xs, ys .- 1, fillto = -1, color = xs, strokecolor = :black, strokewidth = 1)

f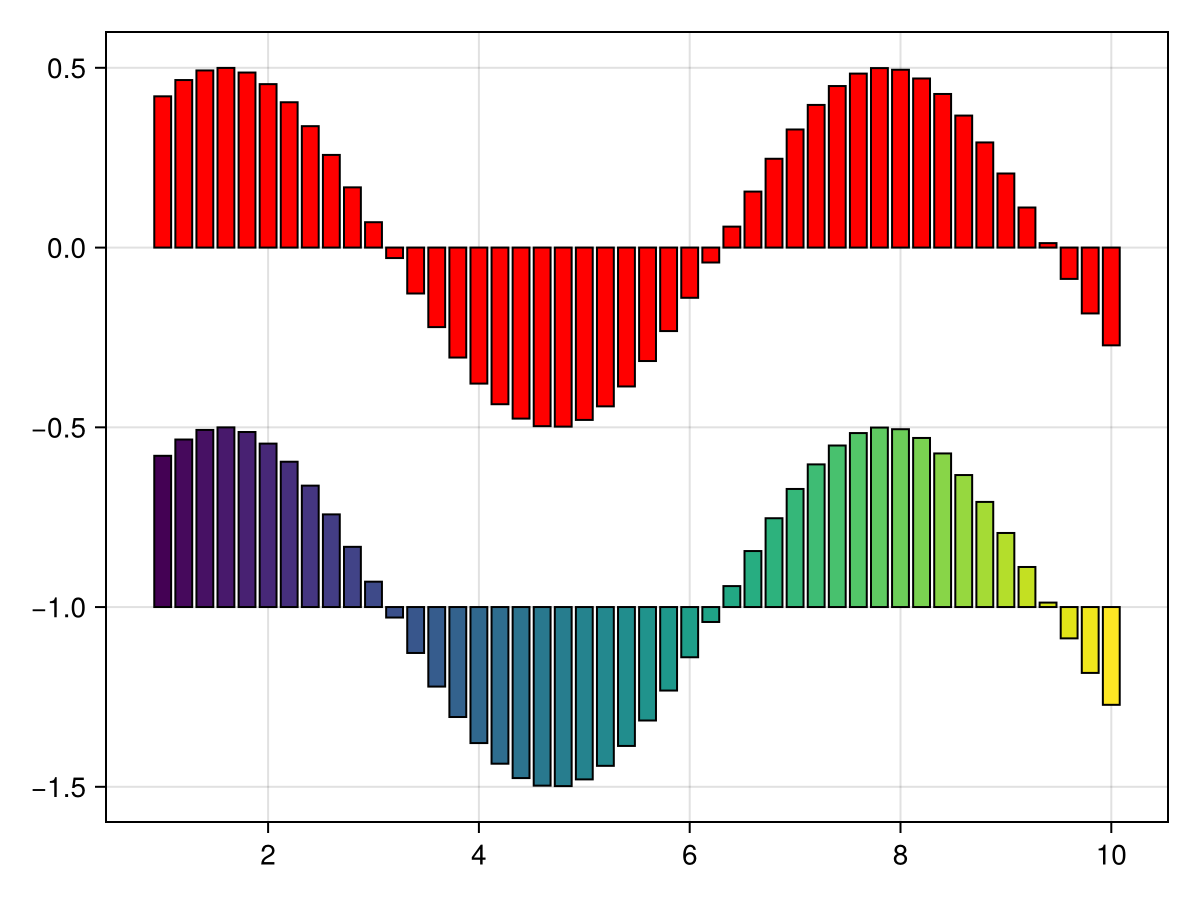
using CairoMakie
xs = 1:0.2:10
ys = 0.5 .* sin.(xs)

barplot(xs, ys, gap = 0, color = :gray85, strokecolor = :black, strokewidth = 1)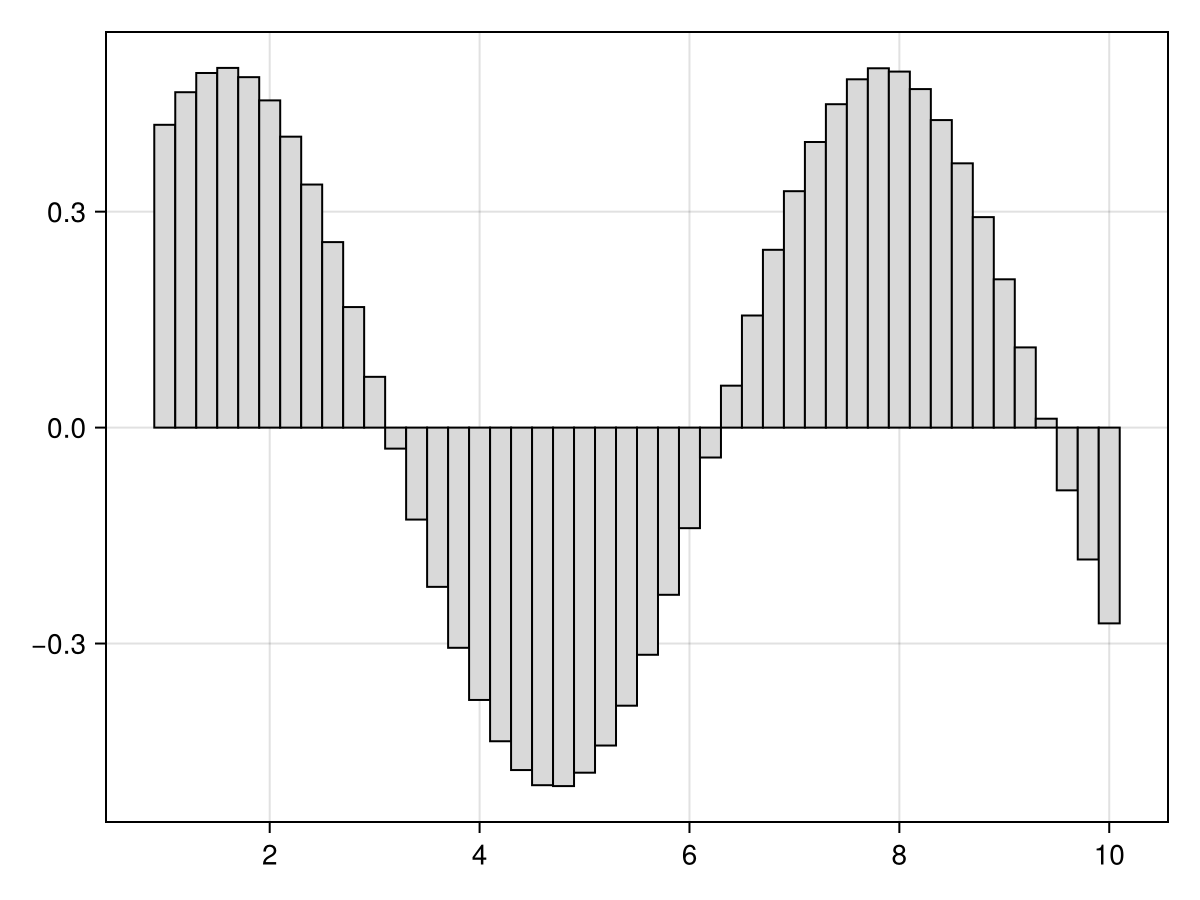
using CairoMakie
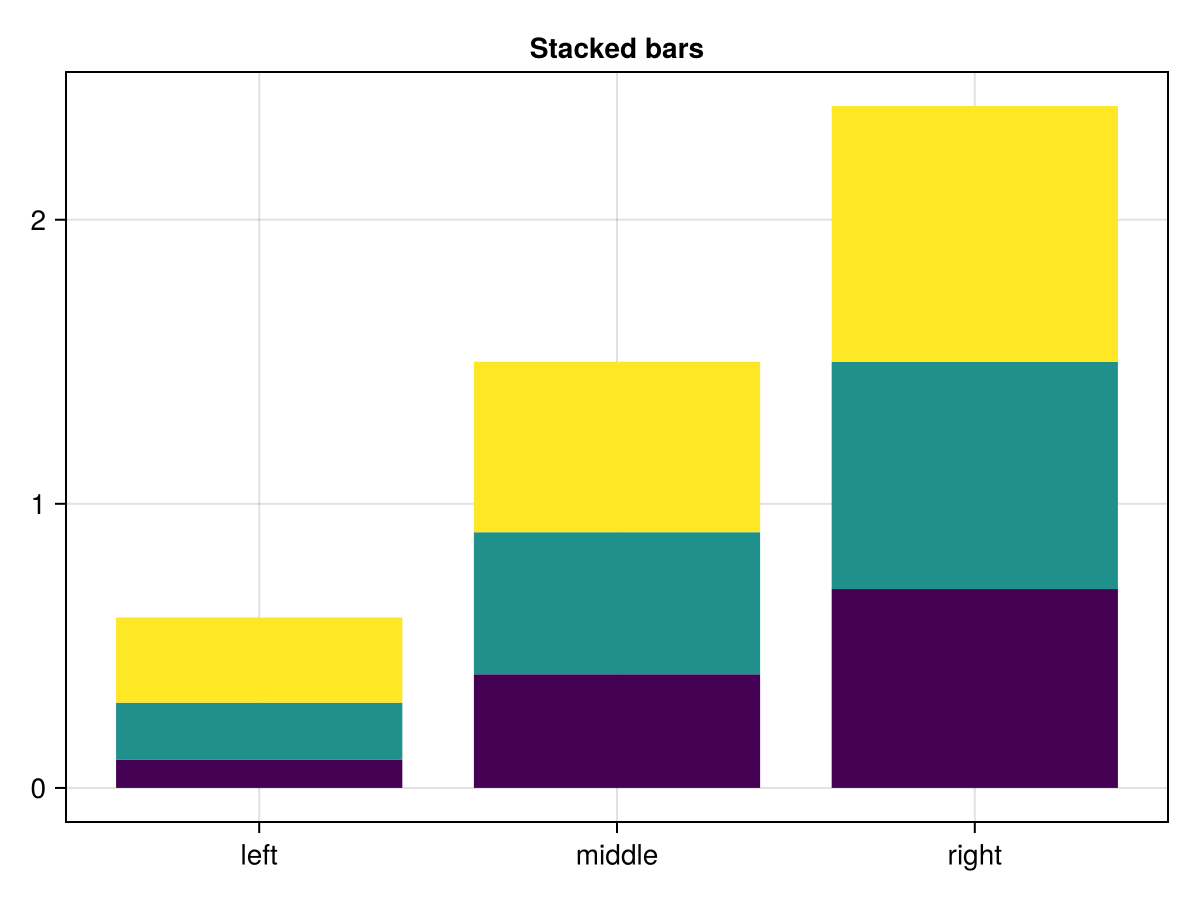
tbl = (cat = [1, 1, 1, 2, 2, 2, 3, 3, 3],
height = 0.1:0.1:0.9,
grp = [1, 2, 3, 1, 2, 3, 1, 2, 3],
grp1 = [1, 2, 2, 1, 1, 2, 1, 1, 2],
grp2 = [1, 1, 2, 1, 2, 1, 1, 2, 1]
)
barplot(tbl.cat, tbl.height,
stack = tbl.grp,
color = tbl.grp,
axis = (xticks = (1:3, ["left", "middle", "right"]),
title = "Stacked bars"),
)
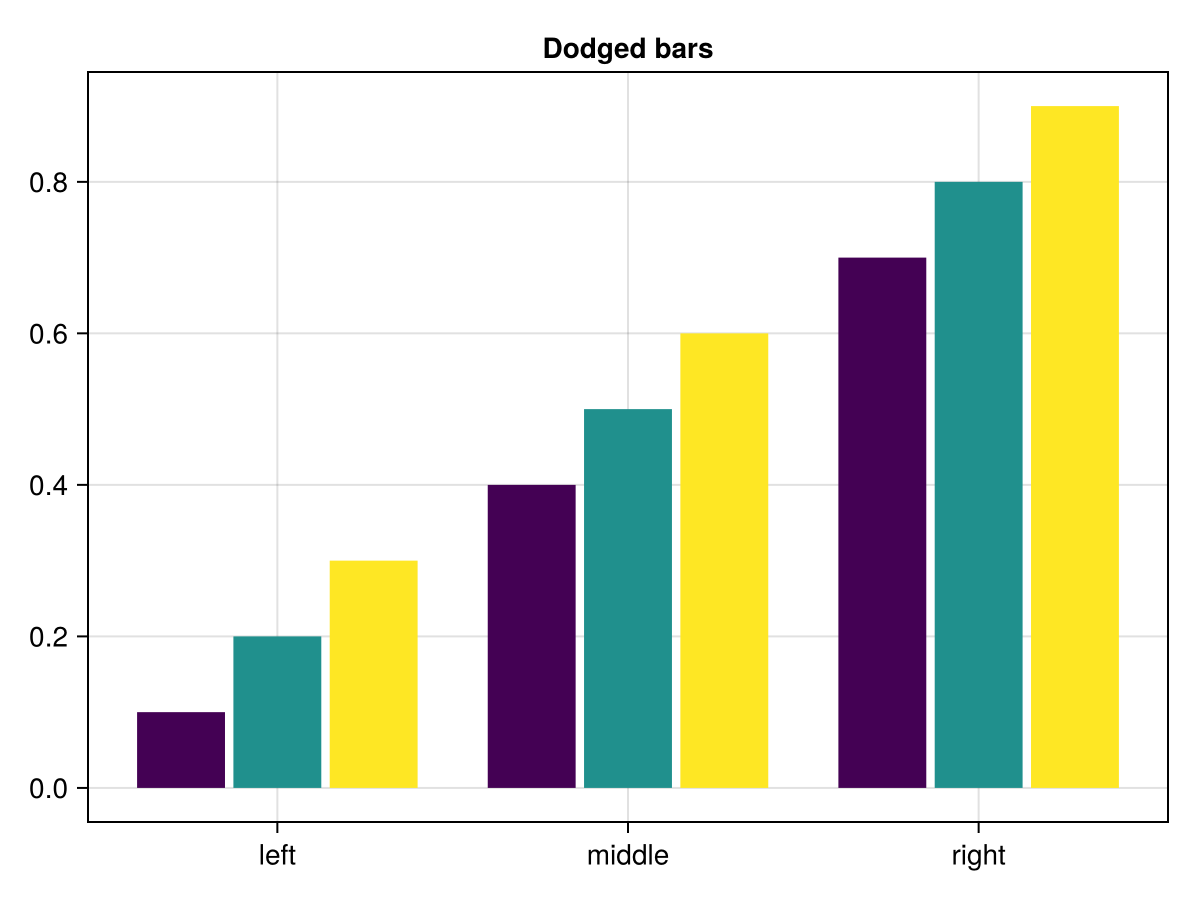
barplot(tbl.cat, tbl.height,
        dodge = tbl.grp,
        color = tbl.grp,
        axis = (xticks = (1:3, ["left", "middle", "right"]),
                title = "Dodged bars"),
        )
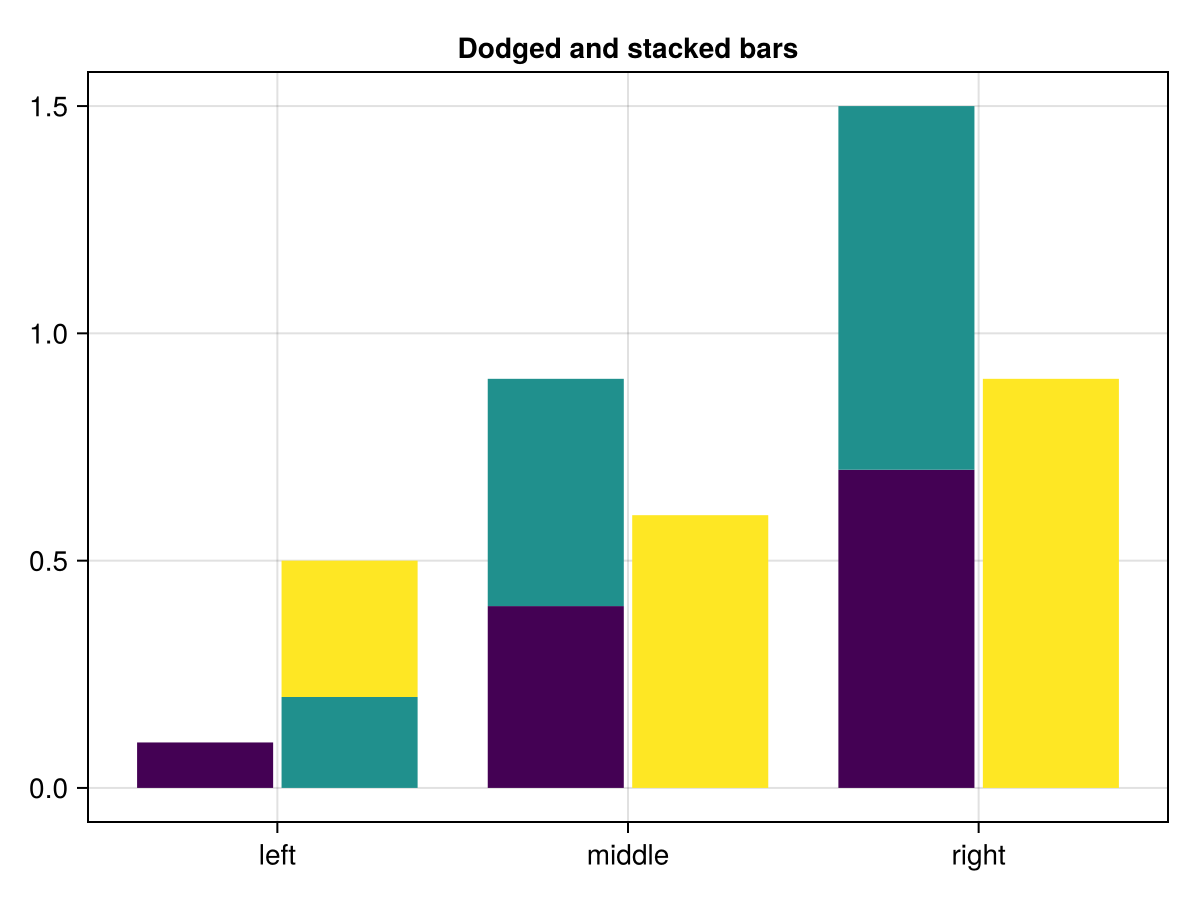
barplot(tbl.cat, tbl.height,
        dodge = tbl.grp1,
        stack = tbl.grp2,
        color = tbl.grp,
        axis = (xticks = (1:3, ["left", "middle", "right"]),
                title = "Dodged and stacked bars"),
        )
colors = Makie.wong_colors()

# Figure and Axis
fig = Figure()
ax = Axis(fig[1,1], xticks = (1:3, ["left", "middle", "right"]),
        title = "Dodged bars with legend")

# Plot
barplot!(ax, tbl.cat, tbl.height,
        dodge = tbl.grp,
        color = colors[tbl.grp])

# Legend
labels = ["group 1", "group 2", "group 3"]
elements = [PolyElement(polycolor = colors[i]) for i in 1:length(labels)]
title = "Groups"

Legend(fig[1,2], elements, labels, title)

fig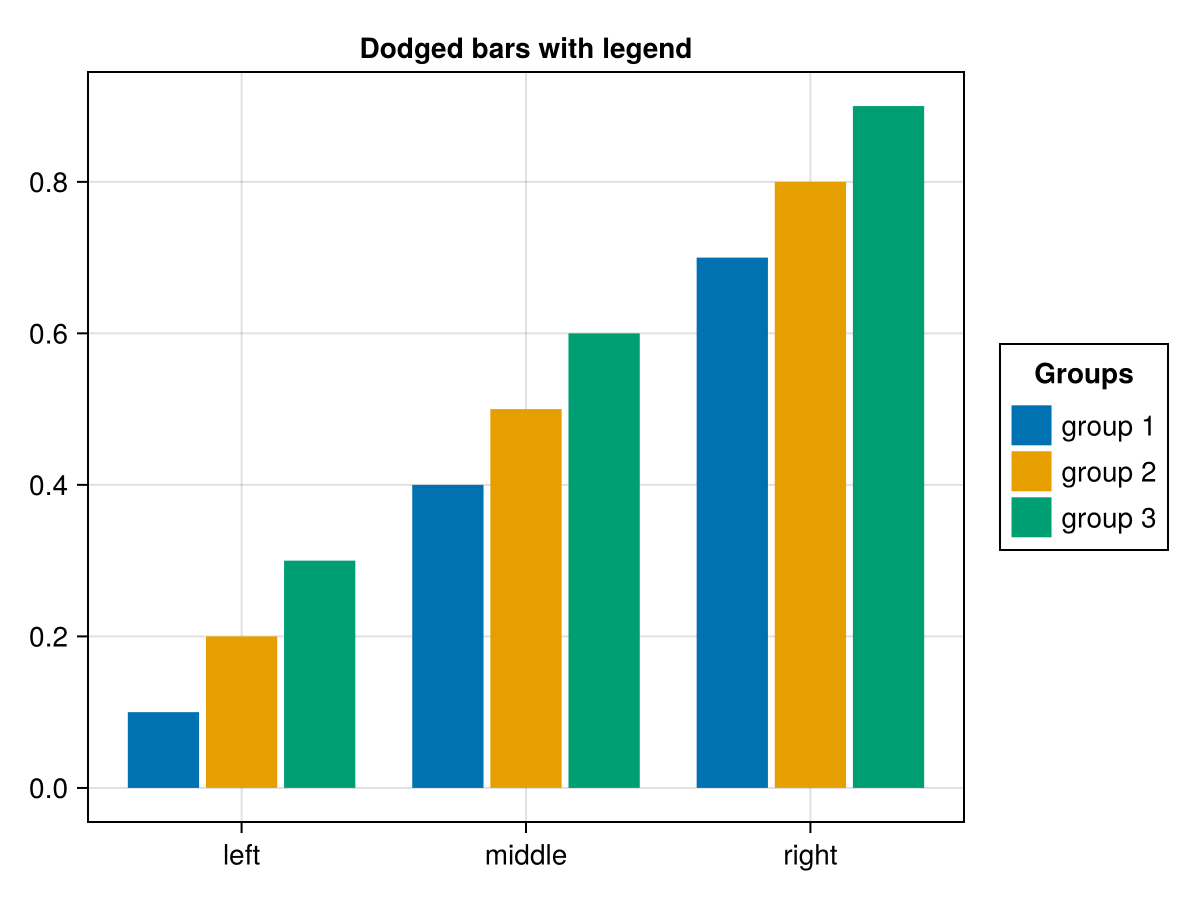
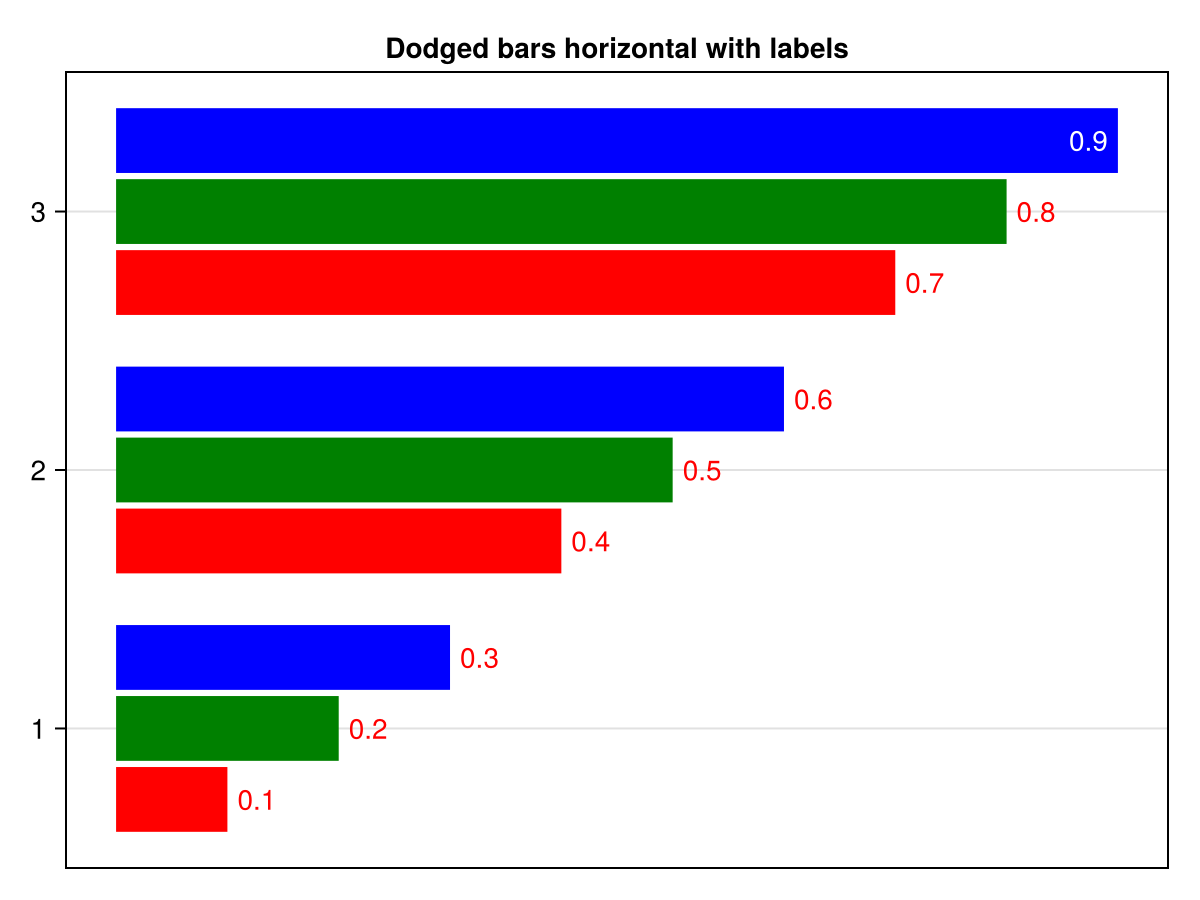
barplot(
    tbl.cat, tbl.height,
    dodge = tbl.grp,
    color = tbl.grp,
    bar_labels = :y,
    axis = (xticks = (1:3, ["left", "middle", "right"]),
            title = "Dodged bars horizontal with labels"),
    colormap = [:red, :green, :blue],
    color_over_background=:red,
    color_over_bar=:white,
    flip_labels_at=0.85,
    direction=:x,
)
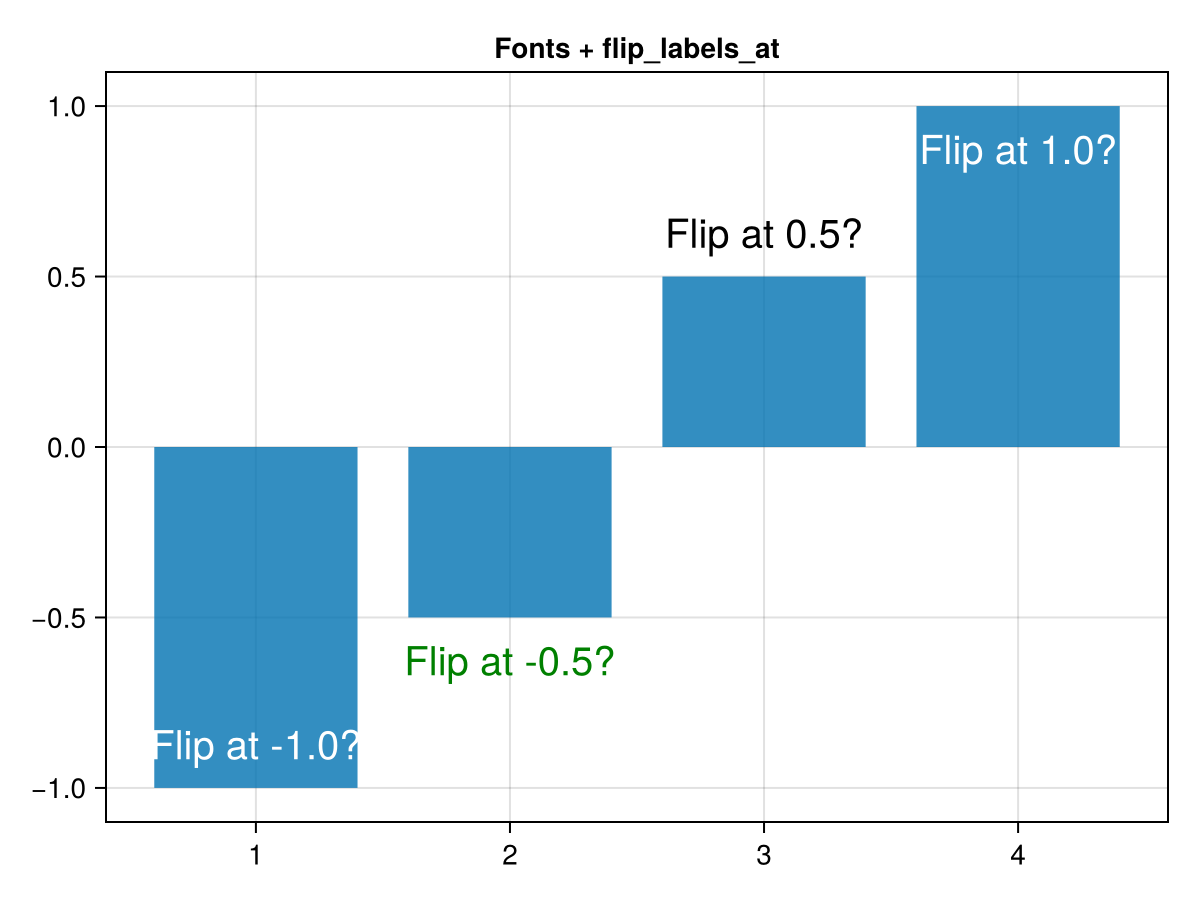
using CairoMakie
barplot([-1, -0.5, 0.5, 1],
    bar_labels = :y,
    axis = (title="Fonts + flip_labels_at",),
    label_size = 20,
    flip_labels_at=(-0.8, 0.8),
    label_color=[:white, :green, :black, :white],
    label_formatter = x-> "Flip at $(x)?",
    label_offset = 10
)
using CairoMakie
gantt = (
    machine = [1, 2, 1, 2],
    job = [1, 1, 2, 3],
    task = [1, 2, 3, 3],
    start = [1, 3, 3.5, 5],
    stop = [3, 4, 5, 6]
)

fig = Figure()
ax = Axis(
    fig[2,1],
    yticks = (1:2, ["A","B"]),
    ylabel = "Machine",
    xlabel = "Time"
)
xlims!(ax, 0, maximum(gantt.stop))

cmap = Makie.to_colormap(:tab10)

barplot!(
    gantt.machine,
    gantt.stop,
    fillto = gantt.start,
    direction = :x,
    color = gantt.job,
    colormap = cmap,
    colorrange = (1, length(cmap)),
    gap = 0.5,
    bar_labels = ["task #$i" for i in gantt.task],
    label_position = :center,
    label_color = :white,
    label = ["job #$i" => (; color = i) for i in unique(gantt.job)]
)

Legend(fig[1,1], ax, "Jobs", orientation=:horizontal, tellwidth = false, tellheight = true)

fig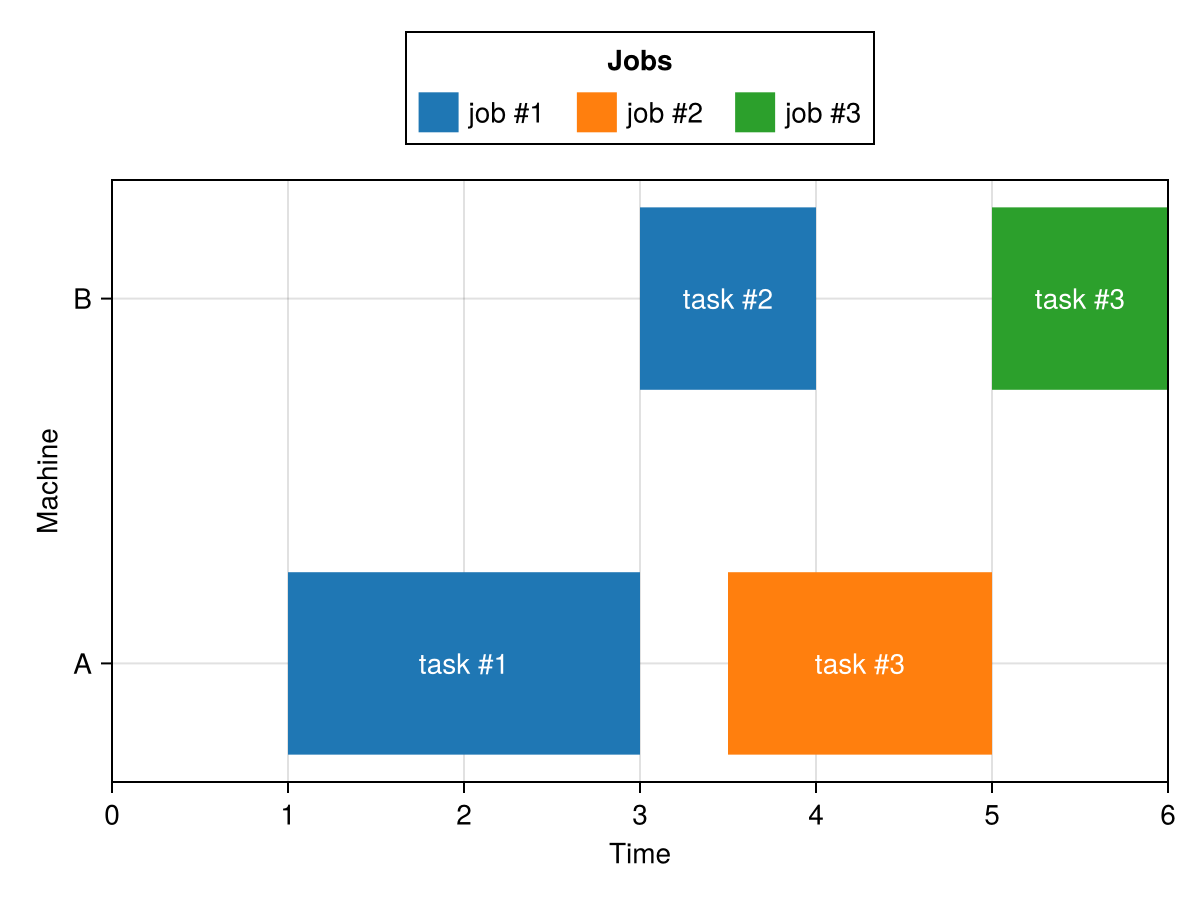
Attributes
alpha
Defaults to 1.0
The alpha value of the colormap or color attribute. Multiple alphas like in plot(alpha=0.2, color=(:red, 0.5), will get multiplied.
clip_planes
Defaults to automatic
Clip planes offer a way to do clipping in 3D space. You can set a Vector of up to 8 Plane3f planes here, behind which plots will be clipped (i.e. become invisible). By default clip planes are inherited from the parent plot or scene. You can remove parent clip_planes by passing Plane3f[].
colormap
Defaults to @inherit colormap :viridis
Sets the colormap that is sampled for numeric colors. PlotUtils.cgrad(...), Makie.Reverse(any_colormap) can be used as well, or any symbol from ColorBrewer or PlotUtils. To see all available color gradients, you can call Makie.available_gradients().
colorscale
Defaults to identity
The color transform function. Can be any function, but only works well together with Colorbar for identity, log, log2, log10, sqrt, logit, Makie.pseudolog10 and Makie.Symlog10.
depth_shift
Defaults to 0.0
adjusts the depth value of a plot after all other transformations, i.e. in clip space, where 0 <= depth <= 1. This only applies to GLMakie and WGLMakie and can be used to adjust render order (like a tunable overdraw).
direction
Defaults to :y
Controls the direction of the bars, can be :y (vertical) or :x (horizontal).
fillto
Defaults to automatic
Controls the baseline of the bars. This is zero in the default automatic case unless the barplot is in a log-scaled Axis. With a log scale, the automatic default is half the minimum value because zero is an invalid value for a log scale.
gap
Defaults to 0.2
The final width of the bars is calculated as w * (1 - gap) where w is the width of each bar as determined with the width attribute.
inspectable
Defaults to @inherit inspectable
Sets whether this plot should be seen by DataInspector. The default depends on the theme of the parent scene.
inspector_clear
Defaults to automatic
Sets a callback function (inspector, plot) -> ... for cleaning up custom indicators in DataInspector.
inspector_hover
Defaults to automatic
Sets a callback function (inspector, plot, index) -> ... which replaces the default show_data methods.
inspector_label
Defaults to automatic
Sets a callback function (plot, index, position) -> string which replaces the default label generated by DataInspector.
label_offset
Defaults to 5
The distance of the labels from the bar ends in screen units. Does not apply when label_position = :center.
label_position
Defaults to :end
The position of each bar’s label relative to the bar. Possible values are :end or :center.
model
Defaults to automatic
Sets a model matrix for the plot. This overrides adjustments made with translate!, rotate! and scale!.
overdraw
Defaults to false
Controls if the plot will draw over other plots. This specifically means ignoring depth checks in GL backends
space
Defaults to :data
sets the transformation space for box encompassing the plot. See Makie.spaces() for possible inputs.
ssao
Defaults to false
Adjusts whether the plot is rendered with ssao (screen space ambient occlusion). Note that this only makes sense in 3D plots and is only applicable with fxaa = true.