waterfall
|
The page is in the process of being translated. |
#
Makie.waterfall — Function
waterfall(x, y; kwargs...)Plots a waterfall chart to visualize individual positive and negative components that add up to a net result as a barplot with stacked bars next to each other.
Plot type
The plot type alias for the waterfall function is Waterfall.
Examples
using CairoMakie
y = [6, 4, 2, -8, 3, 5, 1, -2, -3, 7]

waterfall(y)
using CairoMakie
y = [6, 4, 2, -8, 3, 5, 1, -2, -3, 7]

waterfall(y, show_direction=true)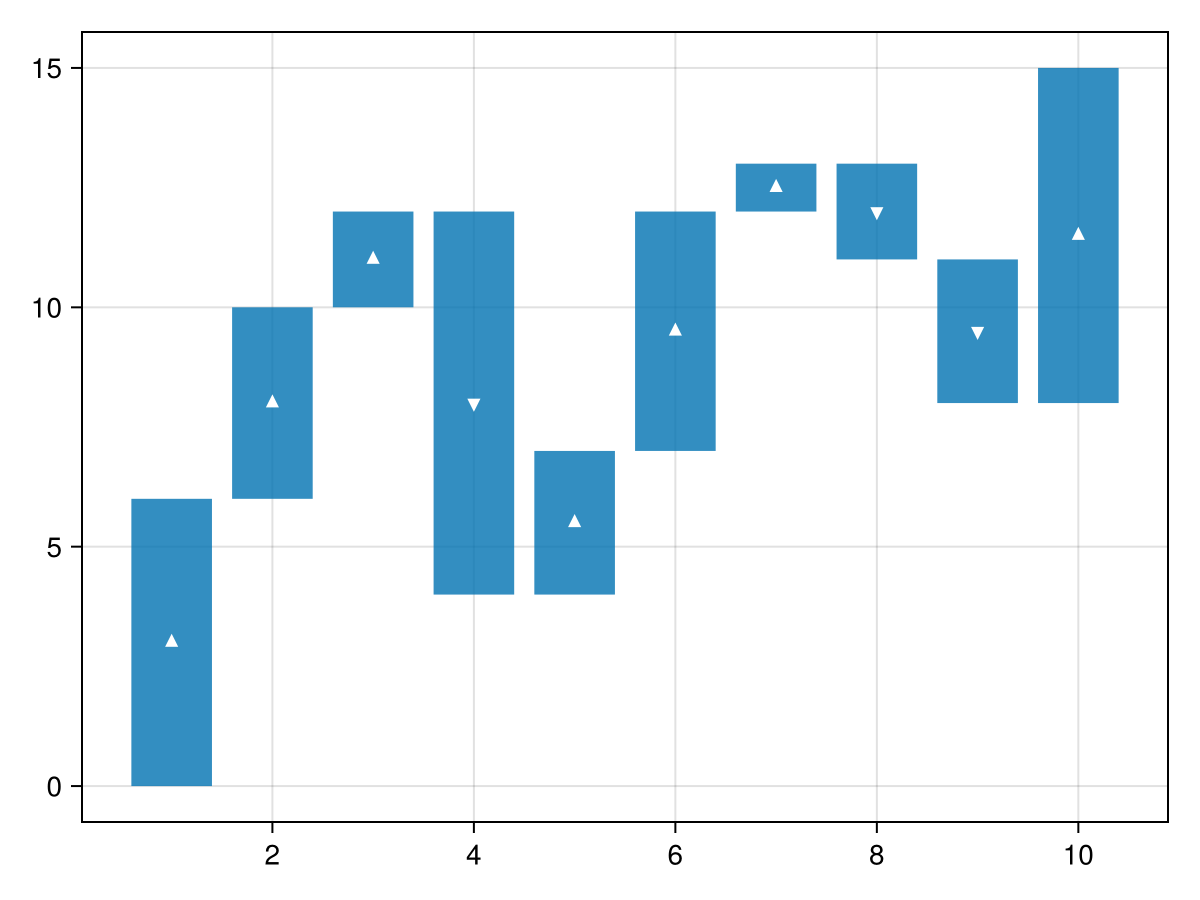
using CairoMakie
y = [6, 4, 2, -8, 3, 5, 1, -2, -3, 7]

waterfall(y, show_direction=true, marker_pos=:cross, marker_neg=:hline, direction_color=:gold)
using CairoMakie
colors = Makie.wong_colors()
x = repeat(1:2, inner=5)
y = [6, 4, 2, -8, 3, 5, 1, -2, -3, 7]
group = repeat(1:5, outer=2)

waterfall(x, y, dodge=group, color=colors[group])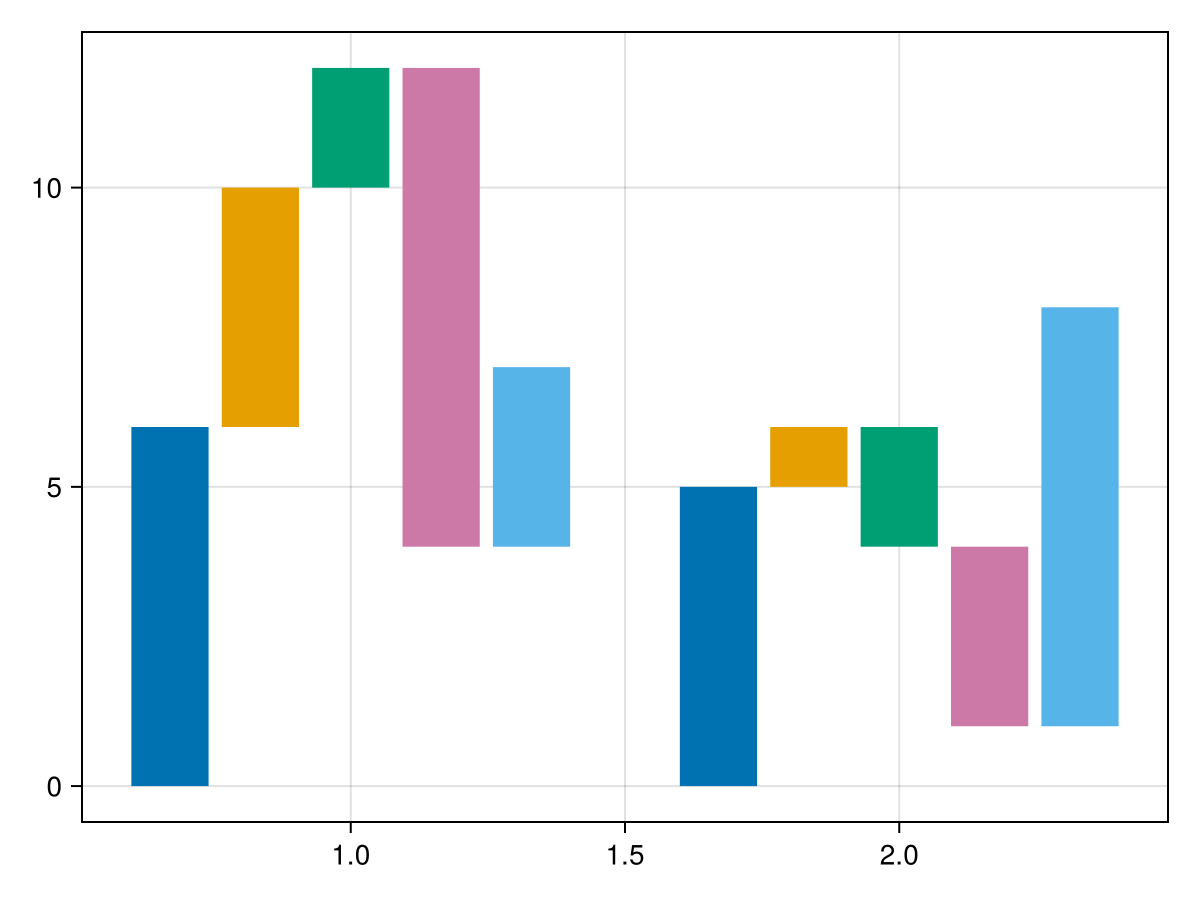
using CairoMakie
colors = Makie.wong_colors()
x = repeat(1:2, inner=5)
y = [6, 4, 2, -8, 3, 5, 1, -2, -3, 7]
group = repeat(1:5, outer=2)

waterfall(x, y, dodge=group, color=colors[group], show_direction=true, show_final=true)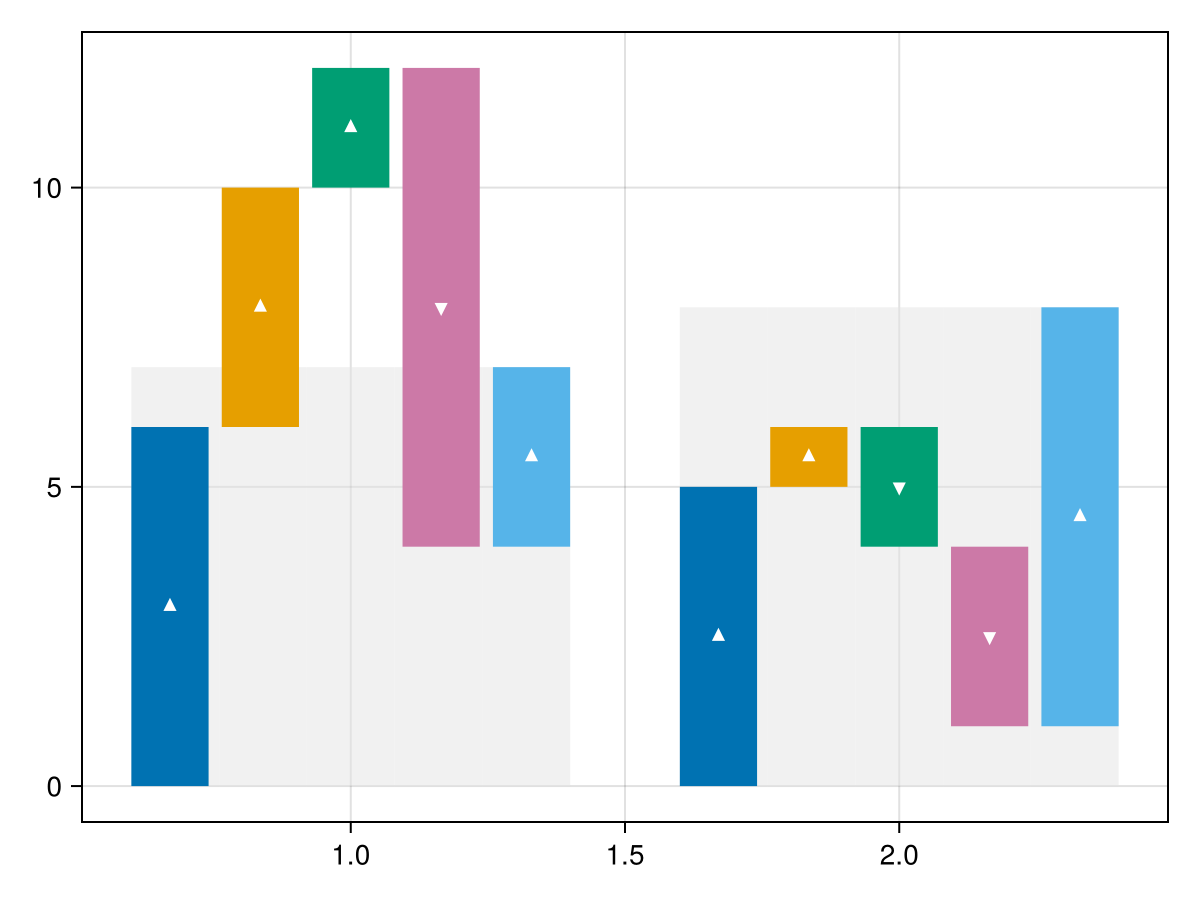
using CairoMakie
colors = Makie.wong_colors()
x = repeat(1:2, inner=5)
y = [6, 4, 2, -8, 3, 5, 1, -2, -3, 7]
group = repeat(1:5, outer=2)

waterfall(x, y, dodge=group, color=colors[group], show_final=true, final_color=(colors[6], 1//3))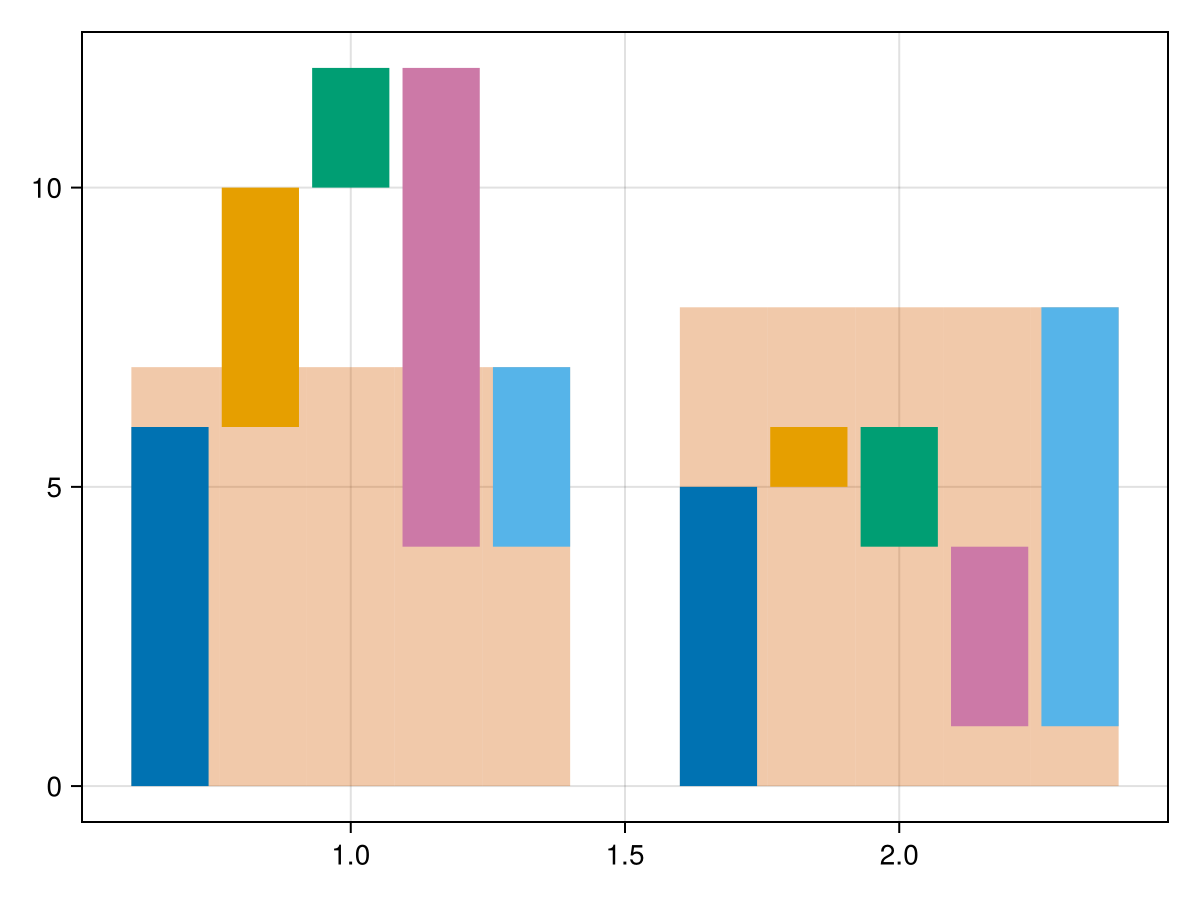
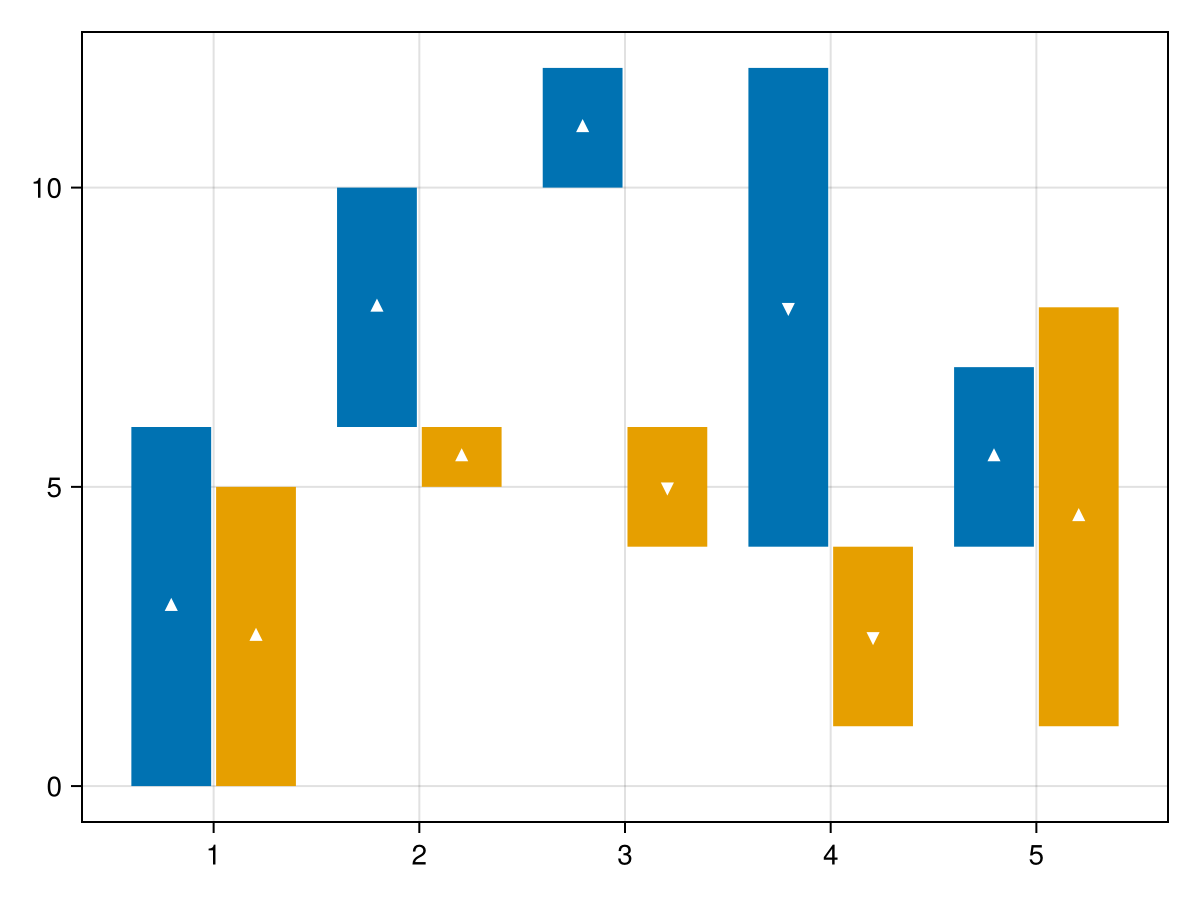
using CairoMakie
colors = Makie.wong_colors()
x = repeat(1:5, outer=2)
y = [6, 4, 2, -8, 3, 5, 1, -2, -3, 7]
group = repeat(1:2, inner=5)

waterfall(x, y, dodge=group, color=colors[group], show_direction=true, stack=:x)