boxplot
|
The page is in the process of being translated. |
#
Makie.boxplot — Function
boxplot(x, y; kwargs...)Draw a Tukey style boxplot. The boxplot has 3 components:
-
a
crossbarspanning the interquartile (IQR) range with a midline marking the median -
an
errorbarwhose whiskers spanrange * iqr -
points marking outliers, that is, data outside the whiskers
Arguments
-
x: positions of the categories -
y: variables within the boxes
Plot type
The plot type alias for the boxplot function is BoxPlot.
Examples
using CairoMakie
categories = rand(1:3, 1000)
values = randn(1000)

boxplot(categories, values)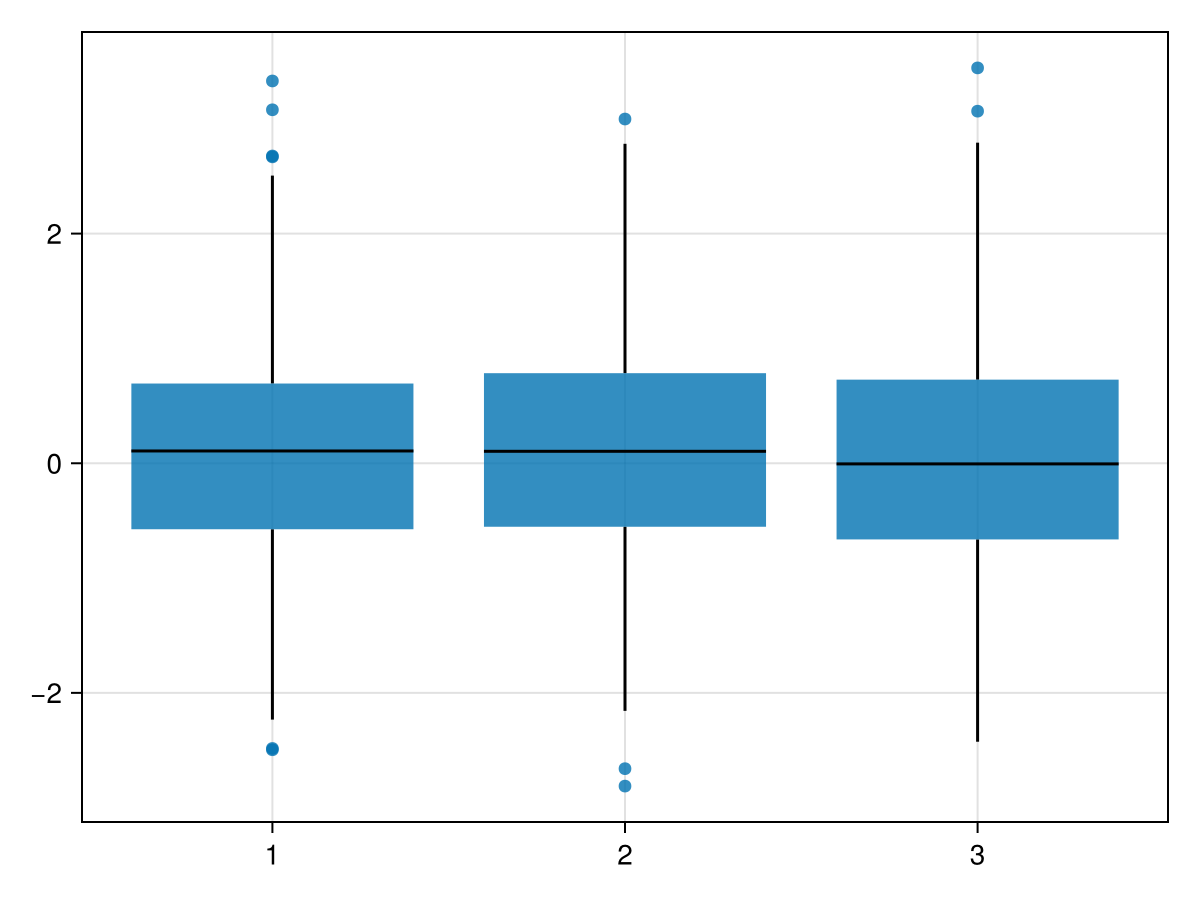
using CairoMakie
categories = rand(1:3, 1000)
values = randn(1000)
dodge = rand(1:2, 1000)

boxplot(categories, values, dodge = dodge, show_notch = true, color = dodge)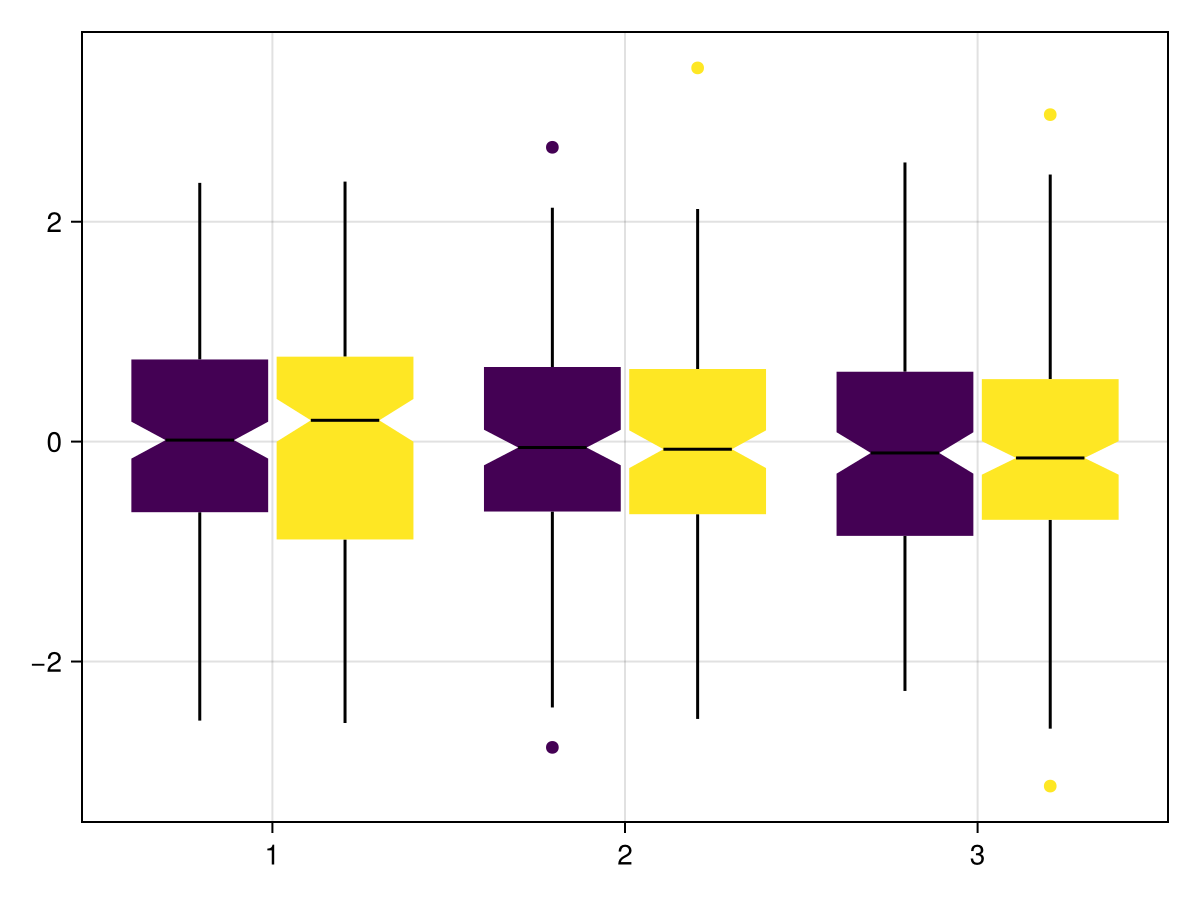
Colors are customizable. The color attribute refers to the color of the boxes, whereas outliercolor refers to the color of the outliers. If not scalars (e.g. :red), these attributes must have the length of the data. If outliercolor is not provided, outliers will have the same color as their box, as shown above.
|
Note For all indices corresponding to points within the same box, |
using CairoMakie
categories = rand(1:3, 1000)
values = randn(1000)
dodge = rand(1:2, 1000)

boxplot(categories, values, dodge = dodge, show_notch = true, color = map(d->d==1 ? :blue : :red, dodge) , outliercolor = rand([:red, :green, :blue, :black, :yellow], 1000))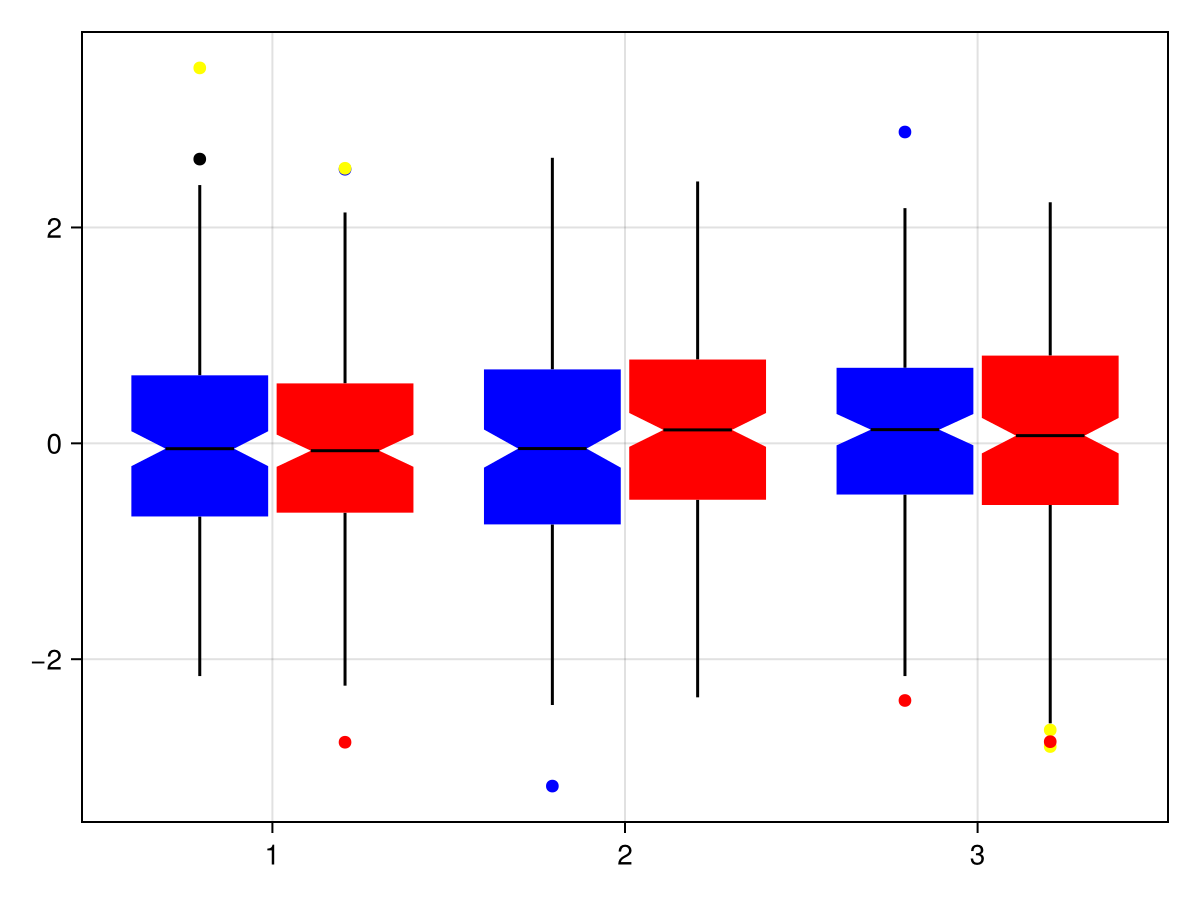
Using statistical weights
using CairoMakie
using Distributions

N = 100_000
x = rand(1:3, N)
y = rand(Uniform(-1, 5), N)

w = pdf.(Normal(), x .- y)

fig = Figure()

boxplot(fig[1,1], x, y)
boxplot(fig[1,2], x, y, weights = w)

fig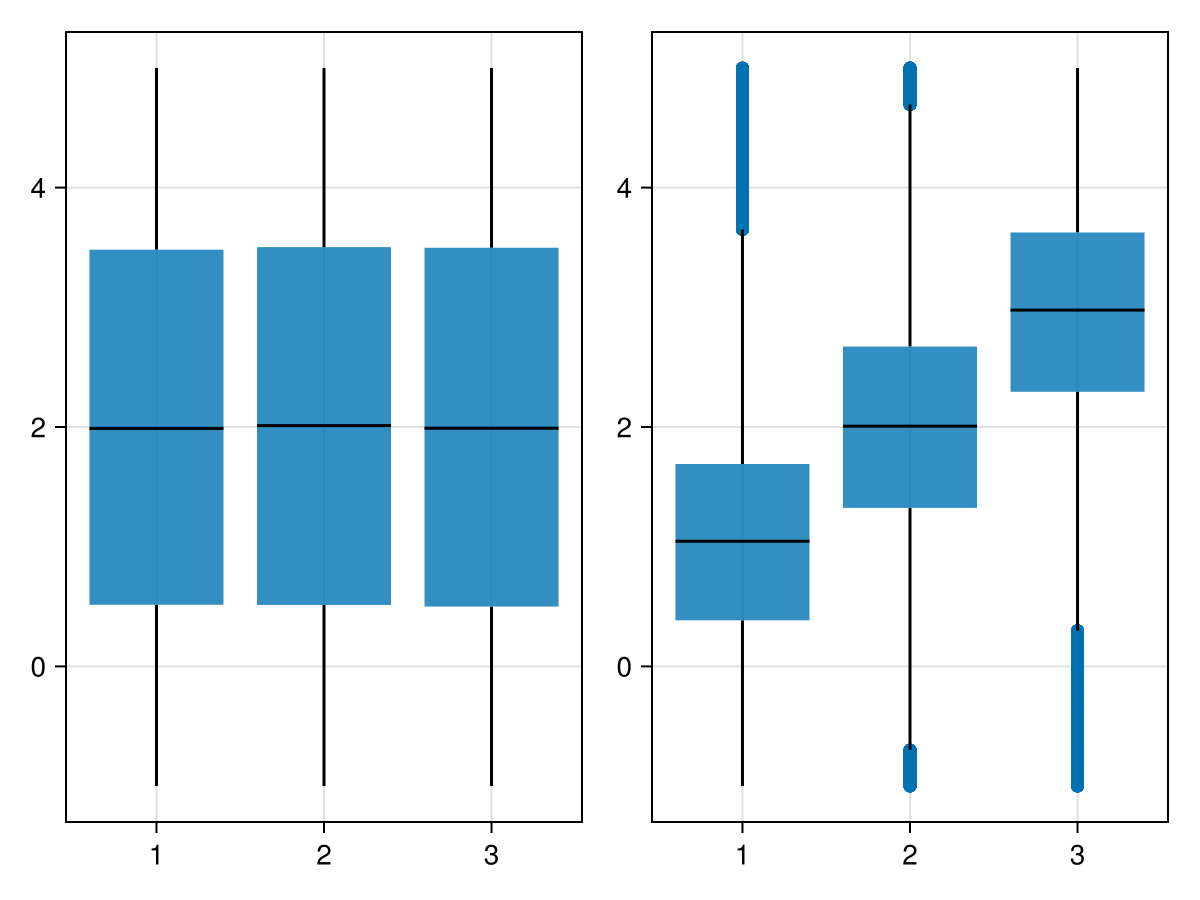
Horizontal axis
using CairoMakie
fig = Figure()

categories = rand(1:3, 1000)
values = randn(1000)

ax_vert = Axis(fig[1,1];
    xlabel = "categories",
    ylabel = "values",
    xticks = (1:3, ["one", "two", "three"])
)
ax_horiz = Axis(fig[1,2];
    xlabel="values", # note that x/y still correspond to horizontal/vertical axes respectively
    ylabel="categories",
    yticks=(1:3, ["one", "two", "three"])
)

# Note: same order of category/value, despite different axes
boxplot!(ax_vert, categories, values) # `orientation=:vertical` is default
boxplot!(ax_horiz, categories, values; orientation=:horizontal)

fig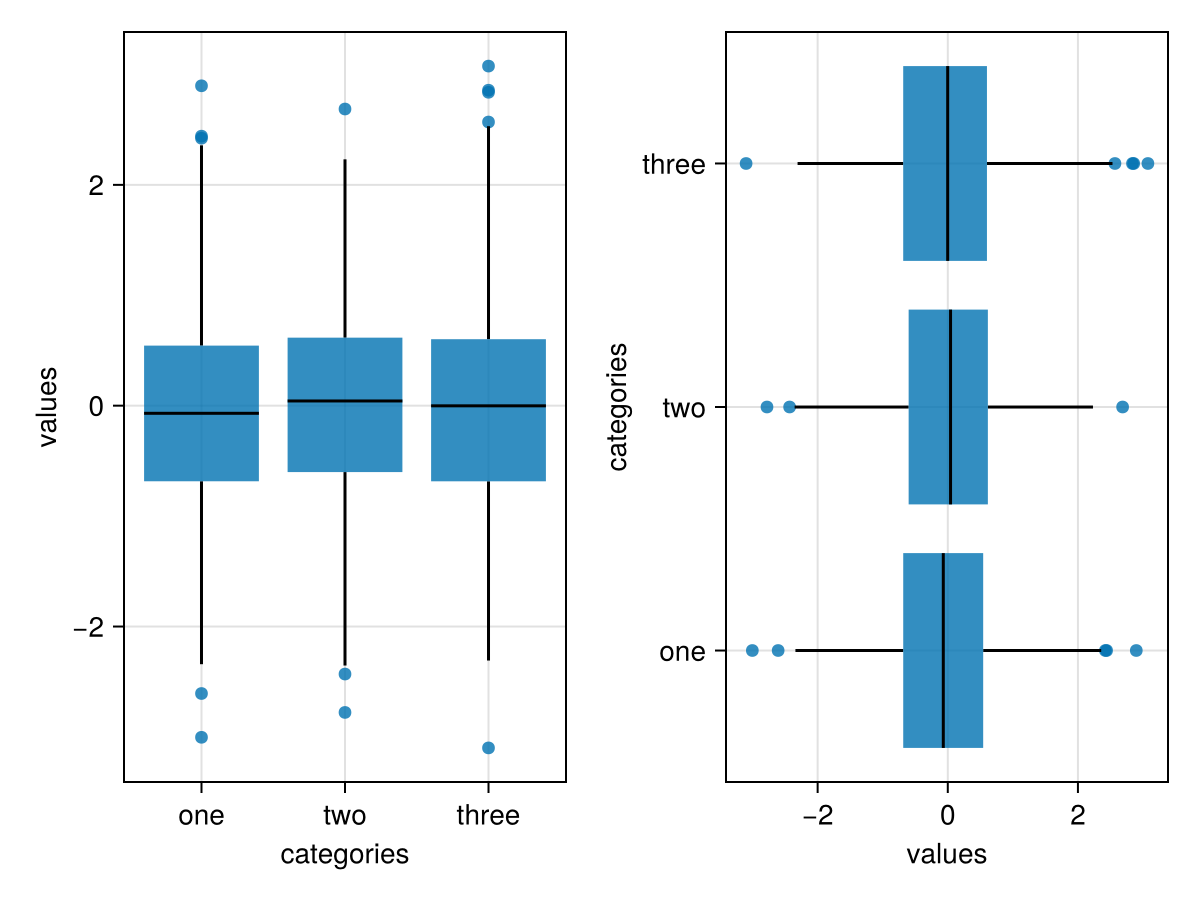
Attributes
dodge
Defaults to automatic
Vector of Integer (length of data) of grouping variable to create multiple side-by-side boxes at the same x position.
weights
Defaults to automatic
Vector of statistical weights (length of data). By default, each observation has weight 1.