contour
|
The page is in the process of being translated. |
#
Makie.contour — Function
contour(x, y, z)
contour(z::Matrix)
Creates a contour plot of the plane spanning x::Vector, y::Vector, z::Matrix. If only z::Matrix is supplied, the indices of the elements in z will be used as the x and y locations when plotting the contour.
Plot type
The plot type alias for the contour function is Contour.
Examples
using CairoMakie
f = Figure()
Axis(f[1, 1])

xs = LinRange(0, 10, 100)
ys = LinRange(0, 15, 100)
zs = [cos(x) * sin(y) for x in xs, y in ys]

contour!(xs, ys, zs)

f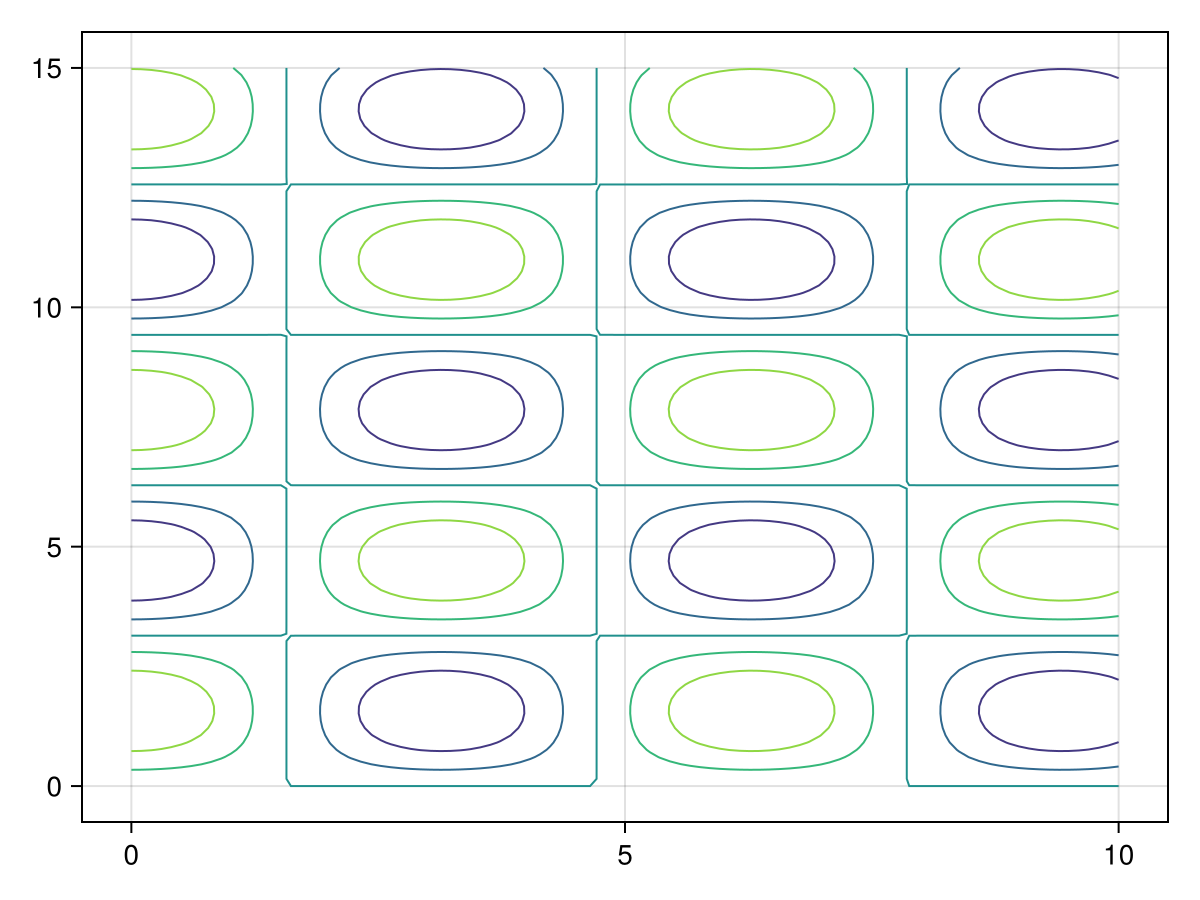
Omitting the xs and ys results in the indices of zs being used. We can also set arbitrary contour-levels using levels
using CairoMakie
f = Figure()
Axis(f[1, 1])

xs = LinRange(0, 10, 100)
ys = LinRange(0, 15, 100)
zs = [cos(x) * sin(y) for x in xs, y in ys]

contour!(zs,levels=-1:0.1:1)

f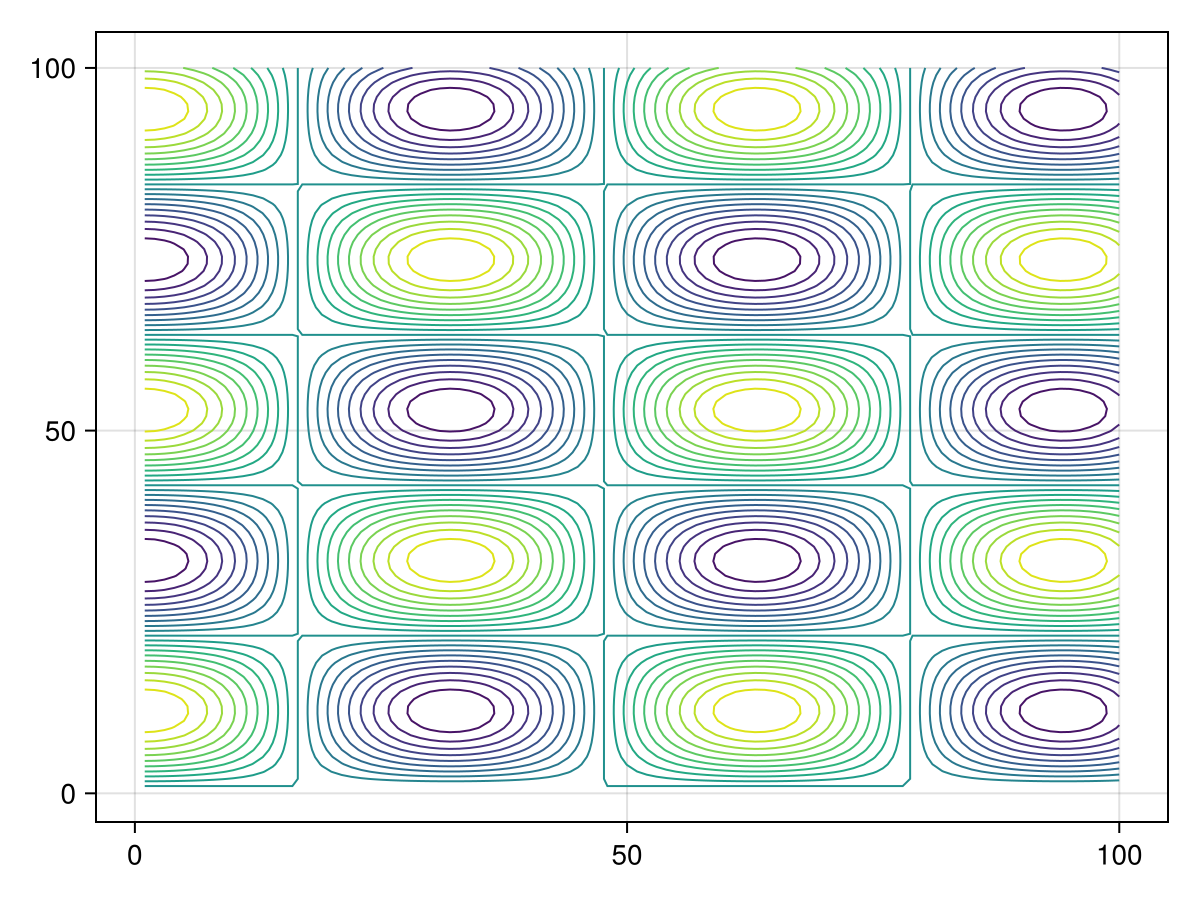
using CairoMakie
himmelblau(x, y) = (x^2 + y - 11)^2 + (x + y^2 - 7)^2
x = y = range(-6, 6; length=100)
z = himmelblau.(x, y')

levels = 10.0.^range(0.3, 3.5; length=10)
colorscale = ReversibleScale(x -> x^(1 / 10), x -> x^10)
f, ax, ct = contour(x, y, z; labels=true, levels, colormap=:hsv, colorscale)
f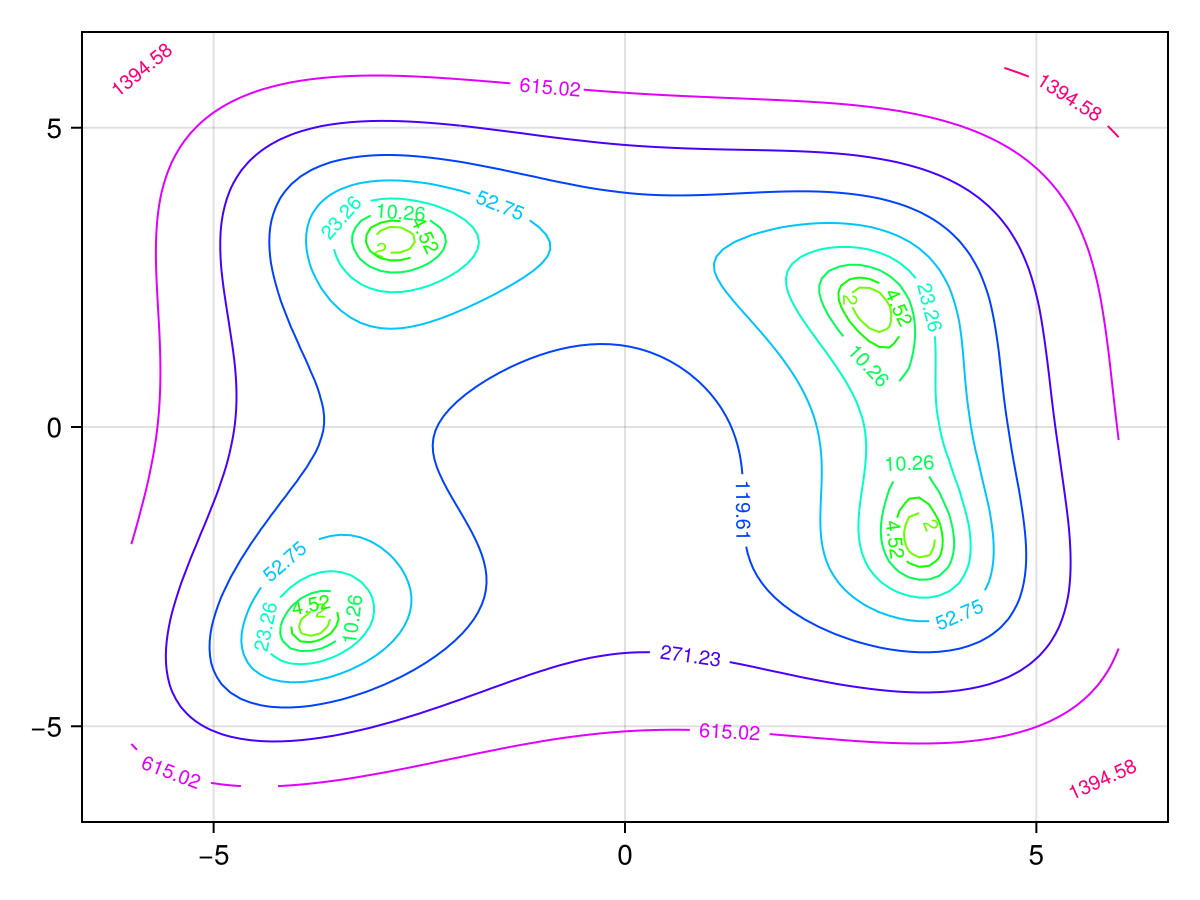
Curvilinear grids
contour also supports curvilinear grids, where x and y are both matrices of the same size as z. This is similar to the input that surface accepts.
using CairoMakie
x = -10:10
y = -10:10
# The curvilinear grid:
xs = [x + 0.01y^3 for x in x, y in y]
ys = [y + 10cos(x/40) for x in x, y in y]

# Now, for simplicity, we calculate the `zs` values to be
# the radius from the center of the grid (0, 10).
zs = sqrt.(xs .^ 2 .+ (ys .- 10) .^ 2)

# We can use Makie's tick finders to get some nice looking contour levels:
levels = Makie.get_tickvalues(Makie.LinearTicks(7), extrema(zs)...)

# and now, we plot!
fig, ax, srf = surface(xs, ys, fill(0f0, size(zs)); color=zs, shading = NoShading, axis = (; type = Axis, aspect = DataAspect()))
ctr = contour!(ax, xs, ys, zs; color = :orange, levels = levels, labels = true, labelfont = :bold, labelsize = 12)

fig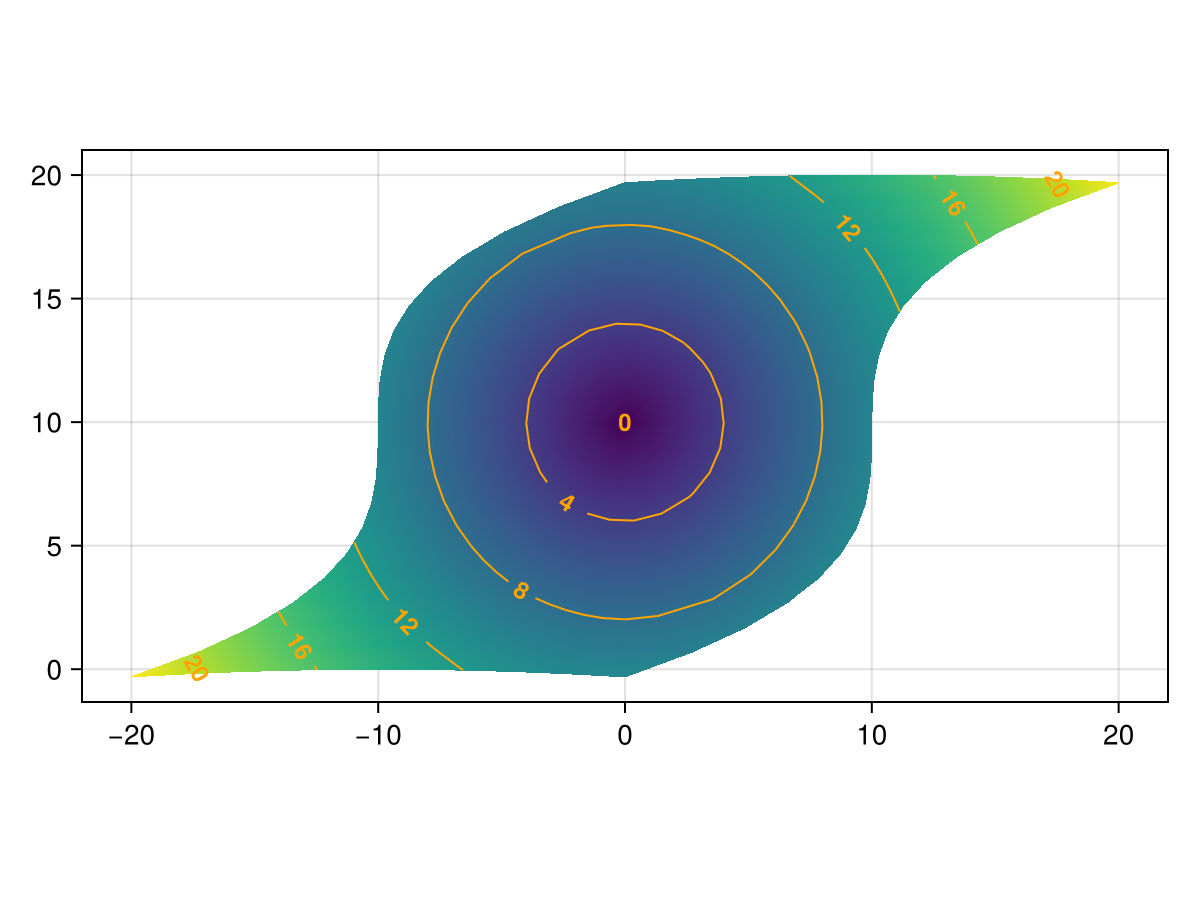
Attributes
alpha
Defaults to 1.0
The alpha value of the colormap or color attribute. Multiple alphas like in plot(alpha=0.2, color=(:red, 0.5), will get multiplied.
clip_planes
Defaults to automatic
Clip planes offer a way to do clipping in 3D space. You can set a Vector of up to 8 Plane3f planes here, behind which plots will be clipped (i.e. become invisible). By default clip planes are inherited from the parent plot or scene. You can remove parent clip_planes by passing Plane3f[].
color
Defaults to nothing
The color of the contour lines. If nothing, the color is determined by the numerical values of the contour levels in combination with colormap and colorrange.
colormap
Defaults to @inherit colormap :viridis
Sets the colormap that is sampled for numeric colors. PlotUtils.cgrad(...), Makie.Reverse(any_colormap) can be used as well, or any symbol from ColorBrewer or PlotUtils. To see all available color gradients, you can call Makie.available_gradients().
colorscale
Defaults to identity
The color transform function. Can be any function, but only works well together with Colorbar for identity, log, log2, log10, sqrt, logit, Makie.pseudolog10 and Makie.Symlog10.
depth_shift
Defaults to 0.0
adjusts the depth value of a plot after all other transformations, i.e. in clip space, where 0 <= depth <= 1. This only applies to GLMakie and WGLMakie and can be used to adjust render order (like a tunable overdraw).
inspectable
Defaults to @inherit inspectable
Sets whether this plot should be seen by DataInspector. The default depends on the theme of the parent scene.
inspector_clear
Defaults to automatic
Sets a callback function (inspector, plot) -> ... for cleaning up custom indicators in DataInspector.
inspector_hover
Defaults to automatic
Sets a callback function (inspector, plot, index) -> ... which replaces the default show_data methods.
inspector_label
Defaults to automatic
Sets a callback function (plot, index, position) -> string which replaces the default label generated by DataInspector.
labelformatter
Defaults to contour_label_formatter
Formats the numeric values of the contour levels to strings.
levels
Defaults to 5
Controls the number and location of the contour lines. Can be either
-
an
Intthat produces n equally wide levels or bands -
an
AbstractVector{<:Real}that lists n consecutive edges from low to high, which result in n-1 levels or bands
model
Defaults to automatic
Sets a model matrix for the plot. This overrides adjustments made with translate!, rotate! and scale!.
overdraw
Defaults to false
Controls if the plot will draw over other plots. This specifically means ignoring depth checks in GL backends
space
Defaults to :data
sets the transformation space for box encompassing the plot. See Makie.spaces() for possible inputs.
ssao
Defaults to false
Adjusts whether the plot is rendered with ssao (screen space ambient occlusion). Note that this only makes sense in 3D plots and is only applicable with fxaa = true.