Makie violin
|
The page is in the process of being translated. |
#
Makie.violin — Function
violin(x, y)Draw a violin plot.
Arguments
-
x: positions of the categories -
y: variables whose density is computed
Plot type
The plot type alias for the violin function is Violin.
Examples
using CairoMakie
categories = rand(1:3, 1000)
values = randn(1000)

violin(categories, values)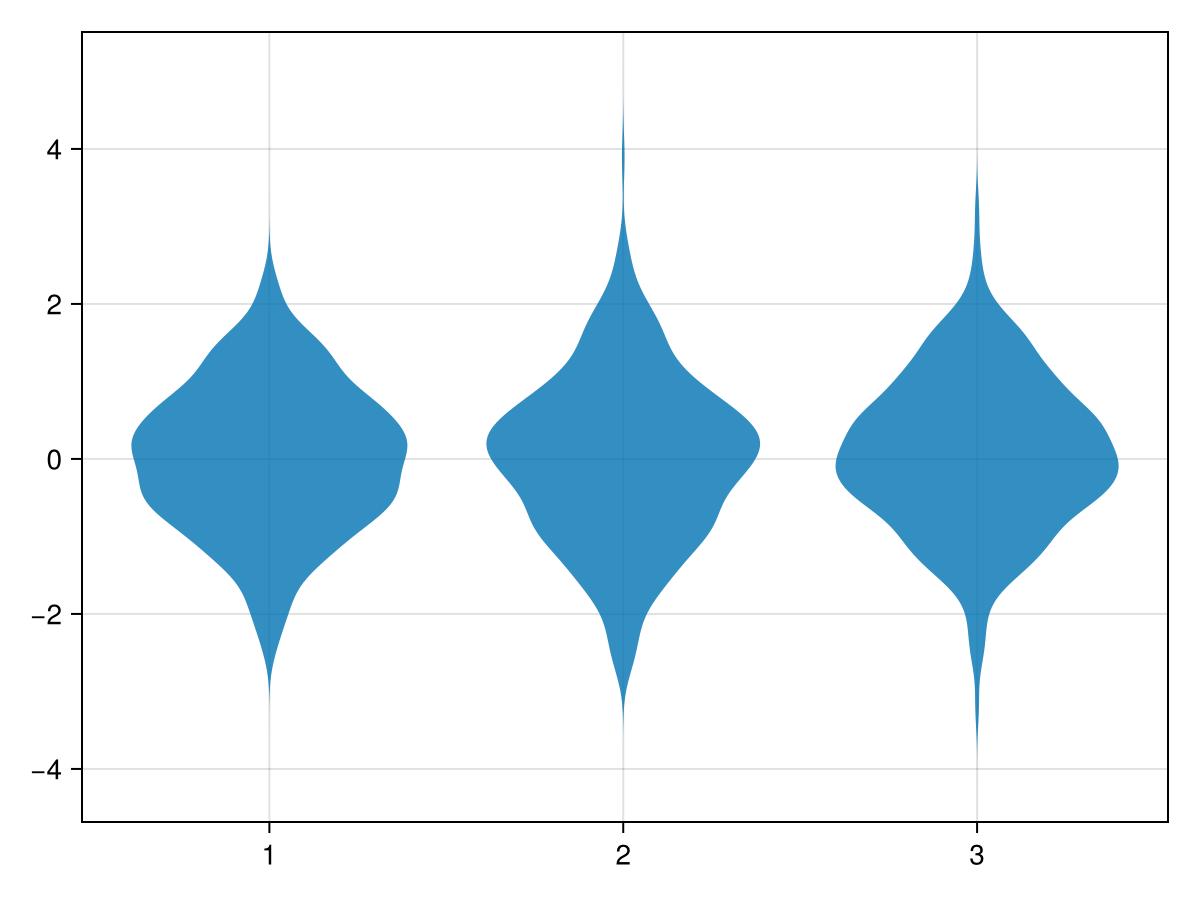
using CairoMakie
fig = Figure()
xs = vcat([fill(i, i * 1000) for i in 1:4]...)
ys = vcat(randn(6000), randn(4000) * 2)
for (i, scale) in enumerate([:area, :count, :width])
    ax = Axis(fig[i, 1])
    violin!(ax, xs, ys; scale, show_median=true)
    Makie.xlims!(0.2, 4.8)
    ax.title = "scale=:$(scale)"
end
fig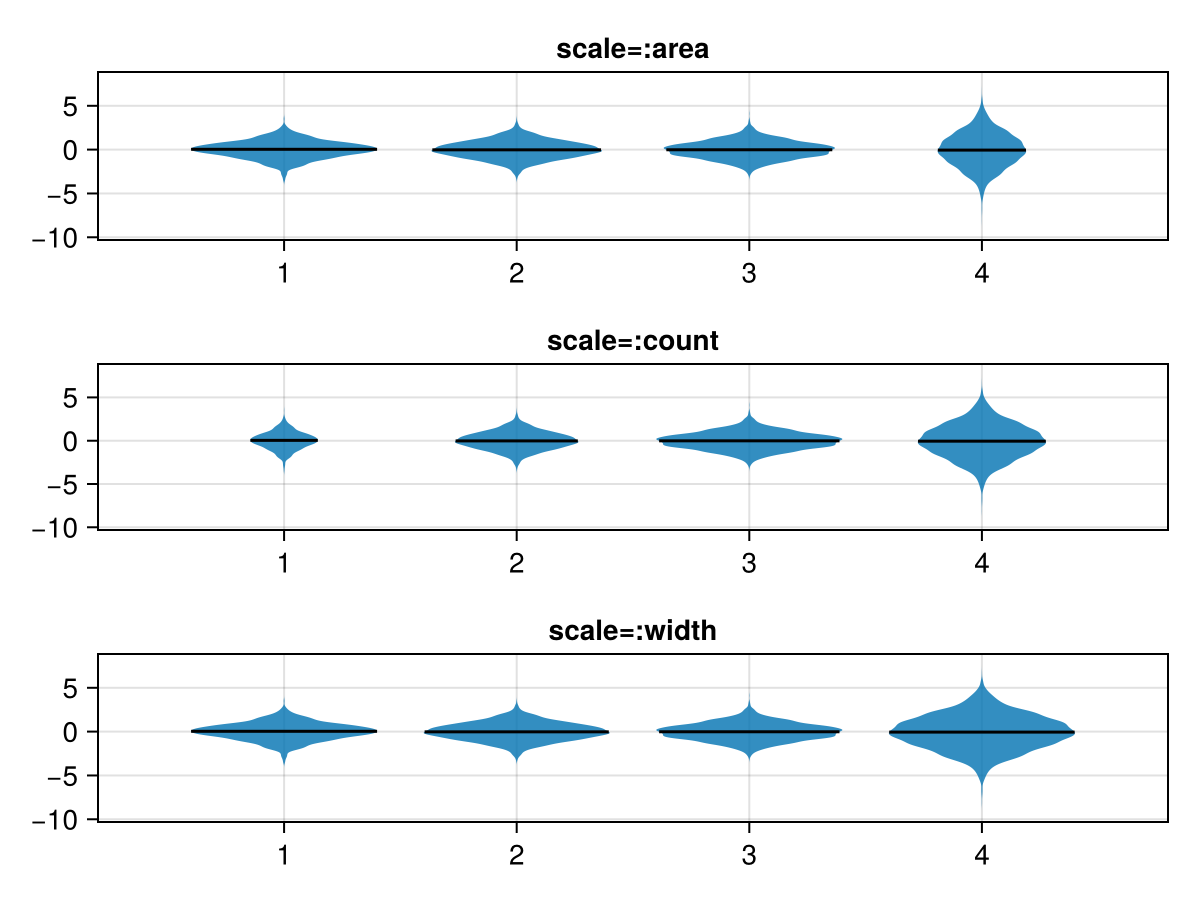
using CairoMakie
categories = rand(1:3, 1000)
values = map(categories) do x
    return x == 1 ? randn() : x == 2 ? 0.5 * randn() : 5 * rand()
end

violin(categories, values, datalimits = extrema)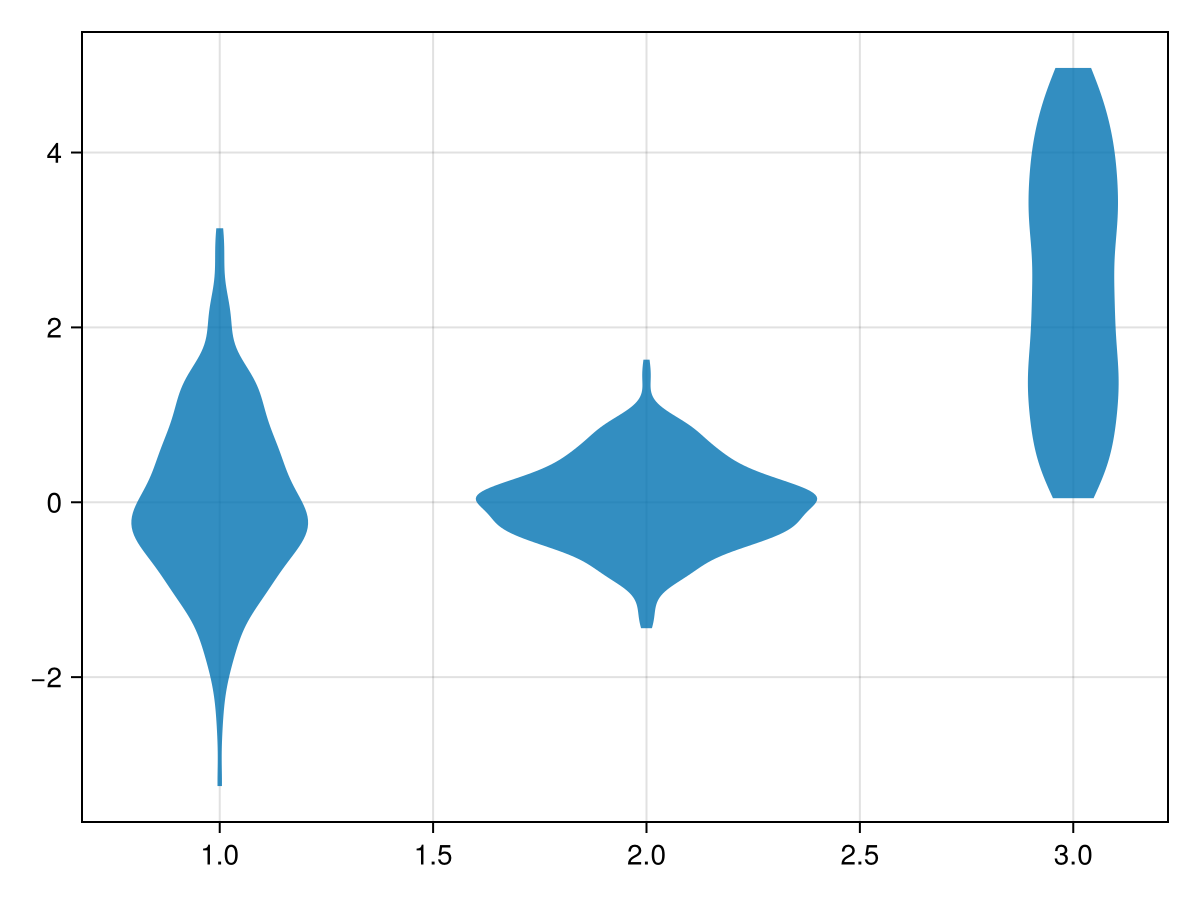
using CairoMakie
N = 1000
categories = rand(1:3, N)
dodge = rand(1:2, N)
side = rand([:left, :right], N)
color = @. ifelse(side === :left, :orange, :teal)
values = map(side) do s
    return s === :left ? randn() : rand()
end

violin(categories, values, dodge = dodge, side = side, color = color)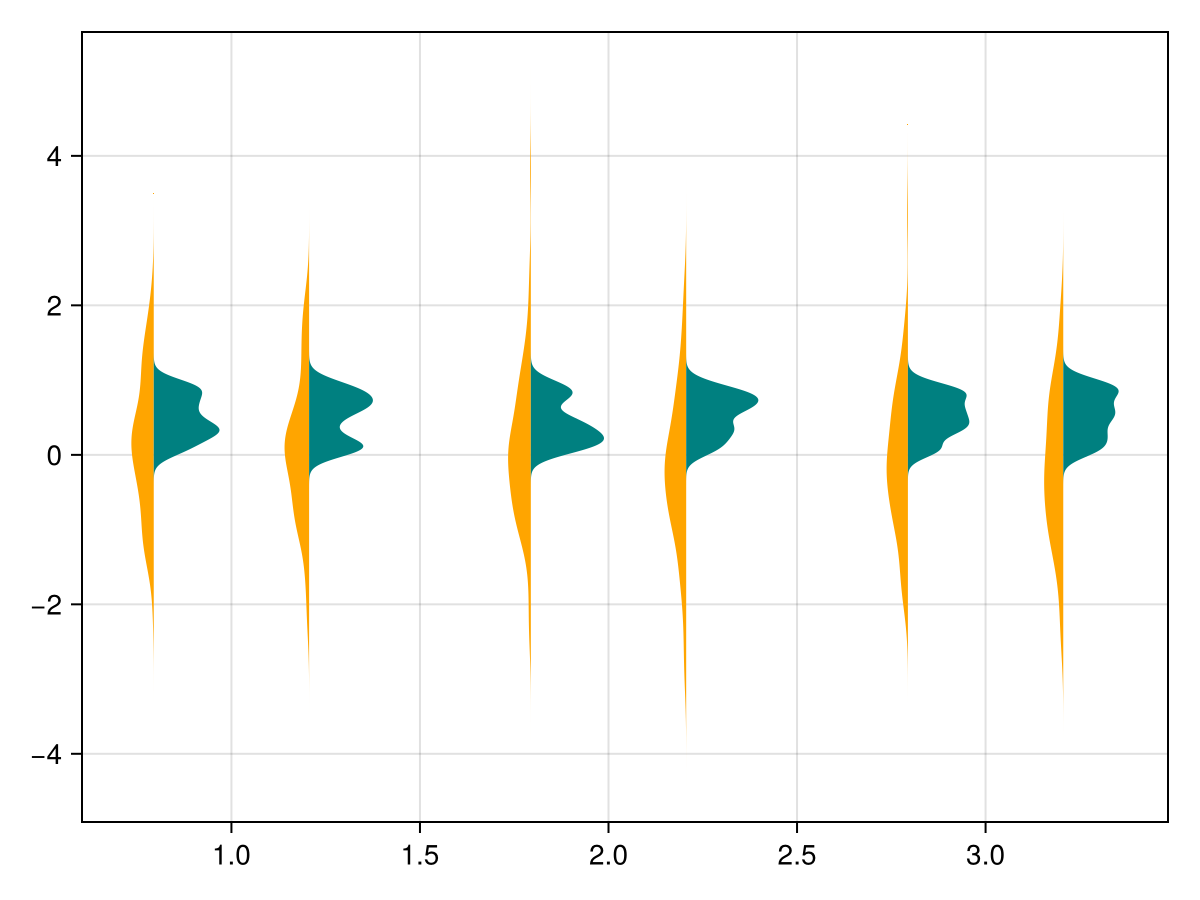
using CairoMakie
N = 1000
categories = rand(1:3, N)
side = rand([:left, :right], N)
color = map(categories, side) do x, s
    colors = s === :left ? [:red, :orange, :yellow] : [:blue, :teal, :cyan]
    return colors[x]
end
values = map(side) do s
    return s === :left ? randn() : rand()
end

violin(categories, values, side = side, color = color)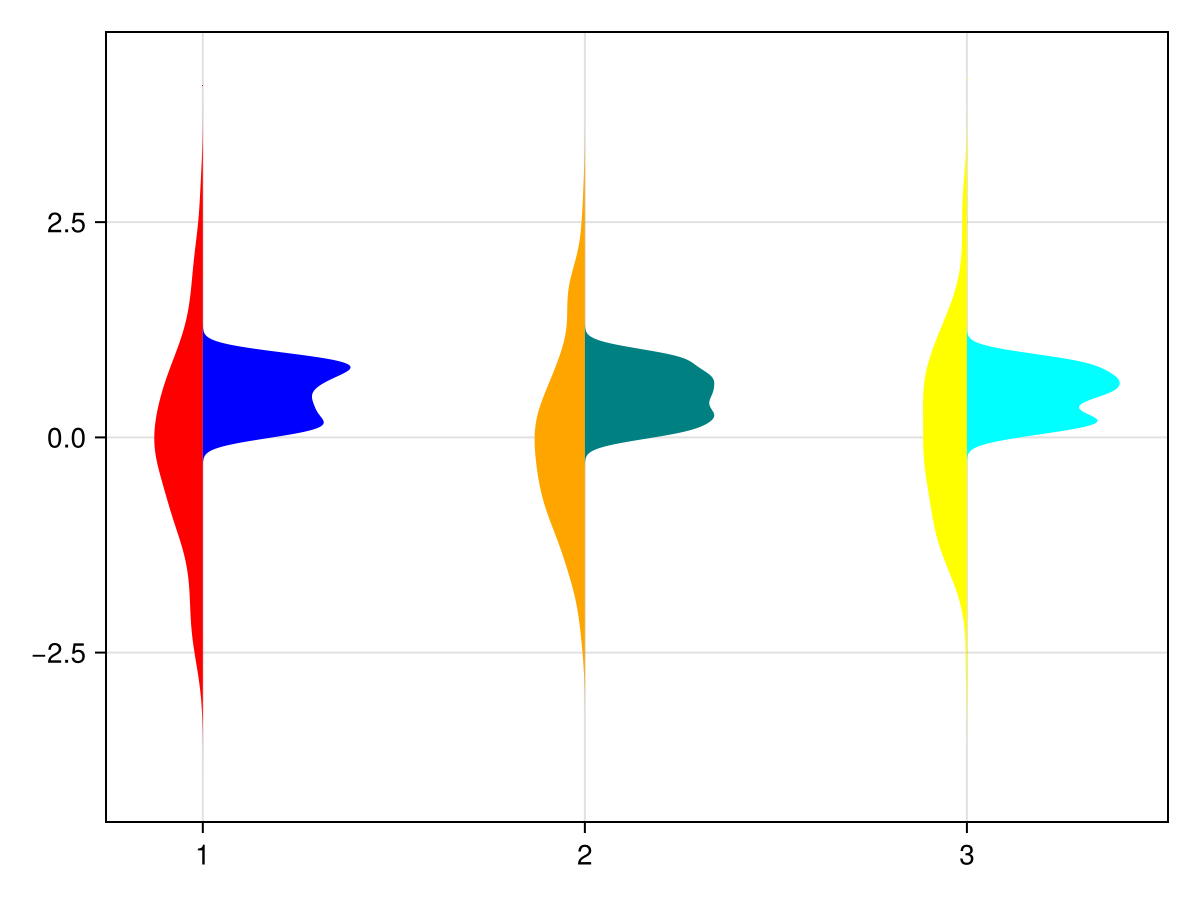
Using statistical weights
using CairoMakie
using Distributions

N = 100_000
categories = rand(1:3, N)
values = rand(Uniform(-1, 5), N)

w = pdf.(Normal(), categories .- values)

fig = Figure()

violin(fig[1,1], categories, values)
violin(fig[1,2], categories, values, weights = w)

fig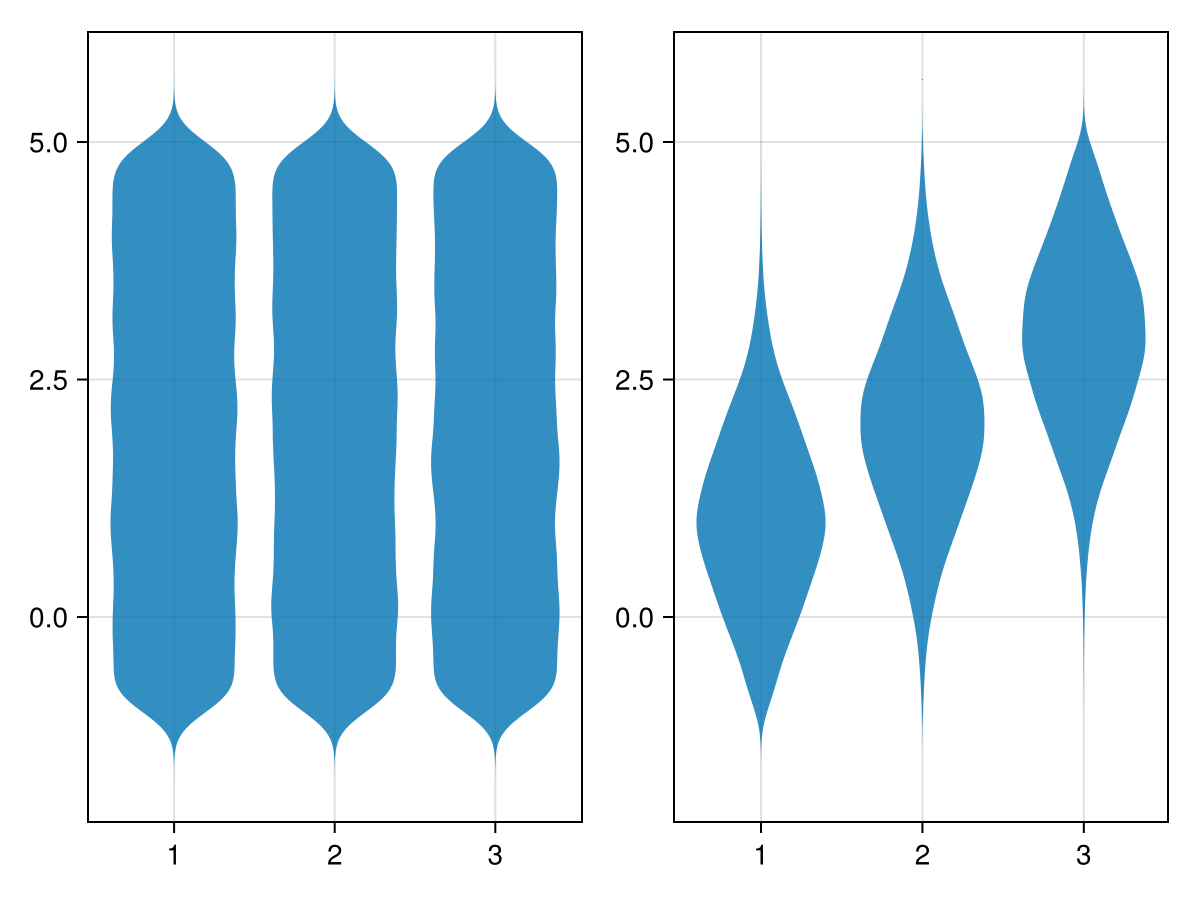
Horizontal axis
using CairoMakie
fig = Figure()

categories = rand(1:3, 1000)
values = randn(1000)

ax_vert = Axis(fig[1,1];
    xlabel = "categories",
    ylabel = "values",
    xticks = (1:3, ["one", "two", "three"])
)
ax_horiz = Axis(fig[1,2];
    xlabel="values", # note that x/y still correspond to horizontal/vertical axes respectively
    ylabel="categories",
    yticks=(1:3, ["one", "two", "three"])
)

# Note: same order of category/value, despite different axes
violin!(ax_vert, categories, values) # `orientation=:vertical` is default
violin!(ax_horiz, categories, values; orientation=:horizontal)

fig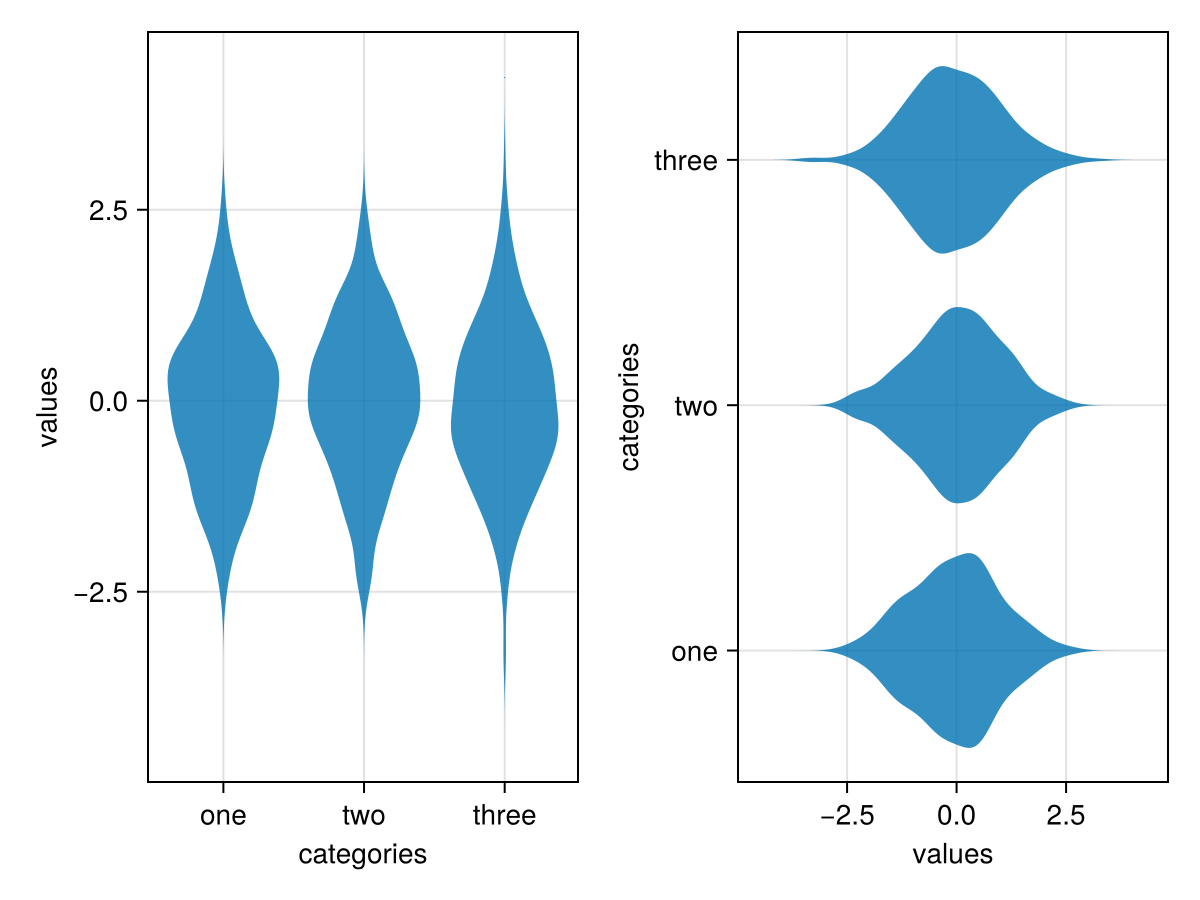
Attributes
clip_planes
Defaults to automatic
Clip planes offer a way to do clipping in 3D space. You can set a Vector of up to 8 Plane3f planes here, behind which plots will be clipped (i.e. become invisible). By default clip planes are inherited from the parent plot or scene. You can remove parent clip_planes by passing Plane3f[].
datalimits
Defaults to (-Inf, Inf)
Specify values to trim the violin. Can be a Tuple or a Function (e.g. datalimits=extrema).
depth_shift
Defaults to 0.0
adjusts the depth value of a plot after all other transformations, i.e. in clip space, where 0 <= depth <= 1. This only applies to GLMakie and WGLMakie and can be used to adjust render order (like a tunable overdraw).
inspectable
Defaults to @inherit inspectable
Sets whether this plot should be seen by DataInspector. The default depends on the theme of the parent scene.
inspector_clear
Defaults to automatic
Sets a callback function (inspector, plot) -> ... for cleaning up custom indicators in DataInspector.
inspector_hover
Defaults to automatic
Sets a callback function (inspector, plot, index) -> ... which replaces the default show_data methods.
inspector_label
Defaults to automatic
Sets a callback function (plot, index, position) -> string which replaces the default label generated by DataInspector.
model
Defaults to automatic
Sets a model matrix for the plot. This overrides adjustments made with translate!, rotate! and scale!.
overdraw
Defaults to false
Controls if the plot will draw over other plots. This specifically means ignoring depth checks in GL backends
space
Defaults to :data
sets the transformation space for box encompassing the plot. See Makie.spaces() for possible inputs.
ssao
Defaults to false
Adjusts whether the plot is rendered with ssao (screen space ambient occlusion). Note that this only makes sense in 3D plots and is only applicable with fxaa = true.
transparency
Defaults to false
Adjusts how the plot deals with transparency. In GLMakie transparency = true results in using Order Independent Transparency.