rainclouds
|
The page is in the process of being translated. |
#
Makie.rainclouds — Function
rainclouds!(ax, category_labels, data_array; plot_boxplots=true, plot_clouds=true, kwargs...)Plot a violin (/histogram), boxplot and individual data points with appropriate spacing between each.
Arguments
-
ax: Axis used to place all these plots onto. -
category_labels: TypicallyVector{String}with a label for each element indata_array -
data_array: TypicallyVector{Float64}used for to represent the datapoints to plot.
Keywords
Plot type
The plot type alias for the rainclouds function is RainClouds.
"Raincloud" plots are a combination of a (half) violin plot, box plot and scatter plots. The three together can make an appealing and informative visual, particularly for large N datasets.
using CairoMakie
using Random
using Makie: rand_localized

####
#### Below is used for testing the plotting functionality.
####

function mockup_distribution(N)
    all_possible_labels = ["Single Mode", "Double Mode", "Random Exp", "Uniform"]
    category_type = rand(all_possible_labels)

    if category_type == "Single Mode"
        random_mean = rand_localized(0, 8)
        random_spread_coef = rand_localized(0.3, 1)
        data_points = random_spread_coef*randn(N) .+ random_mean

    elseif category_type == "Double Mode"
        random_mean = rand_localized(0, 8)
        random_spread_coef = rand_localized(0.3, 1)
        data_points = random_spread_coef*randn(Int(round(N/2.0))) .+ random_mean

        random_mean = rand_localized(0, 8)
        random_spread_coef = rand_localized(0.3, 1)
        data_points = vcat(data_points, random_spread_coef*randn(Int(round(N/2.0))) .+ random_mean)

    elseif category_type == "Random Exp"
        data_points = randexp(N)

    elseif category_type == "Uniform"
        min = rand_localized(0, 4)
        max = min + rand_localized(0.5, 4)
        data_points = [rand_localized(min, max) for _ in 1:N]

    else
        error("Unidentified category.")
    end

    return data_points
end

function mockup_categories_and_data_array(num_categories; N = 500)
    category_labels = String[]
    data_array = Float64[]

    for category_label in string.(('A':'Z')[1:min(num_categories, end)])
        data_points = mockup_distribution(N)

        append!(category_labels, fill(category_label, N))
        append!(data_array, data_points)
    end
    return category_labels, data_array
end

category_labels, data_array = mockup_categories_and_data_array(3)

colors = Makie.wong_colors()
rainclouds(category_labels, data_array;
    axis = (; xlabel = "Categories of Distributions", ylabel = "Samples", title = "My Title"),
    plot_boxplots = false, cloud_width=0.5, clouds=hist, hist_bins=50,
    color = colors[indexin(category_labels, unique(category_labels))])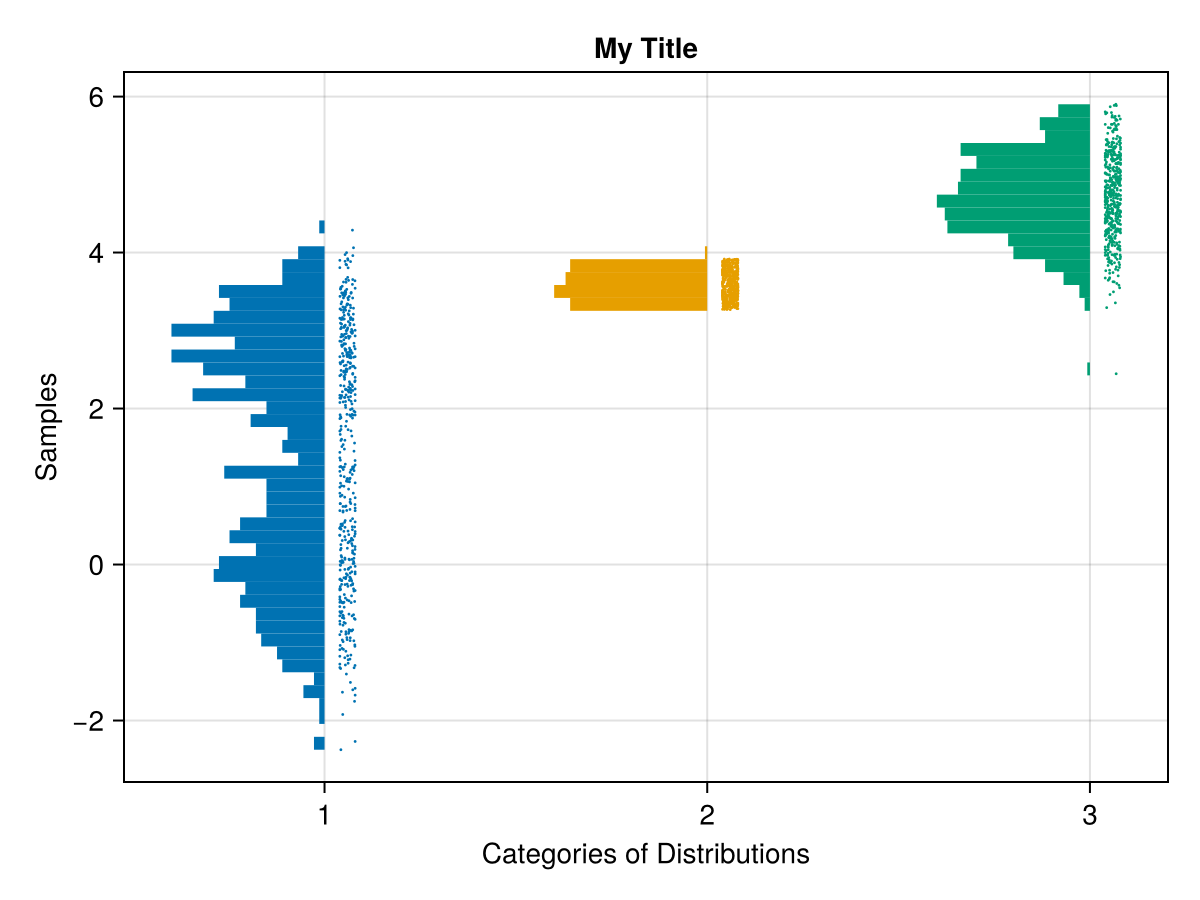
rainclouds(category_labels, data_array;
    axis = (; ylabel = "Categories of Distributions",
    xlabel = "Samples", title = "My Title"),
    orientation = :horizontal,
    plot_boxplots = true, cloud_width=0.5, clouds=hist,
    color = colors[indexin(category_labels, unique(category_labels))])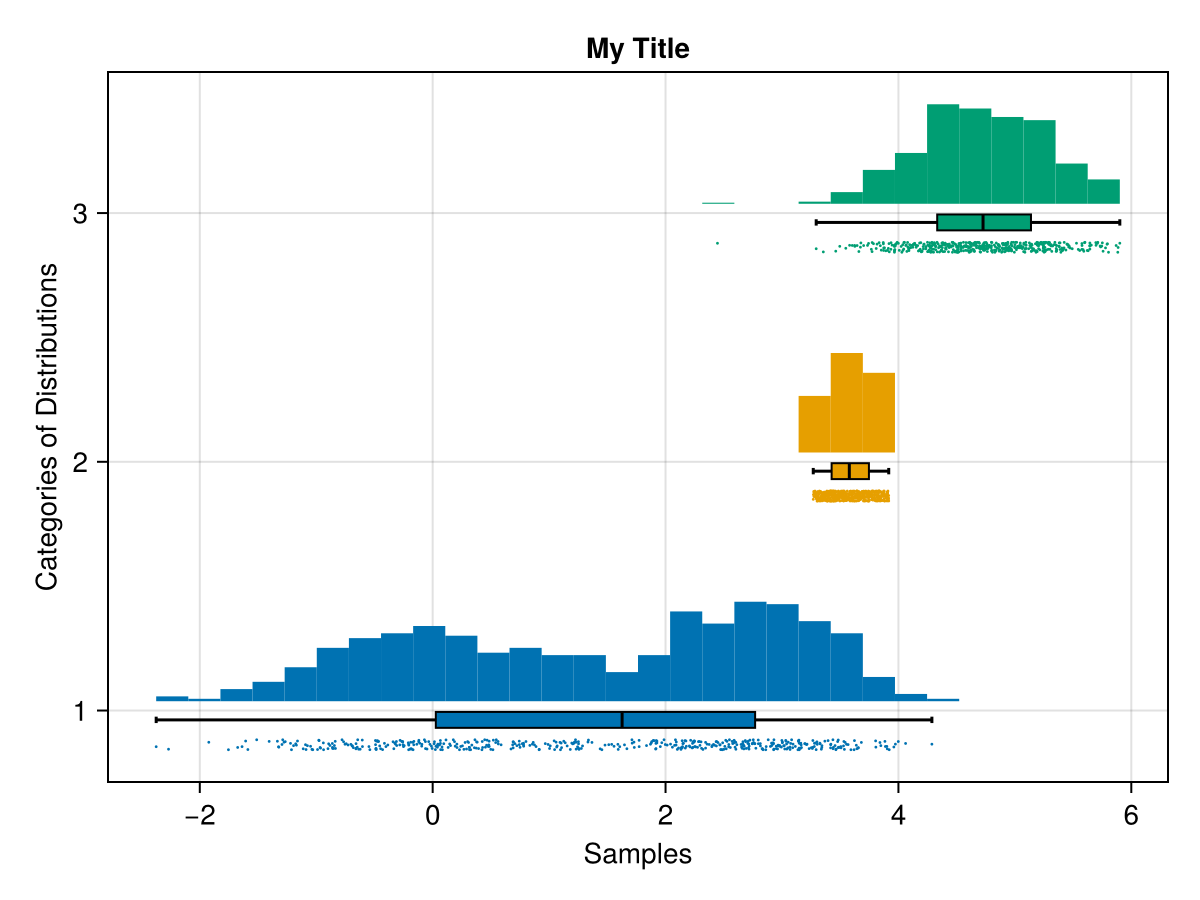
rainclouds(category_labels, data_array;
    axis = (;
        xlabel = "Categories of Distributions",
        ylabel = "Samples",
        title = "My Title"
    ),
    plot_boxplots = true, cloud_width=0.5, clouds=hist,
    color = colors[indexin(category_labels, unique(category_labels))])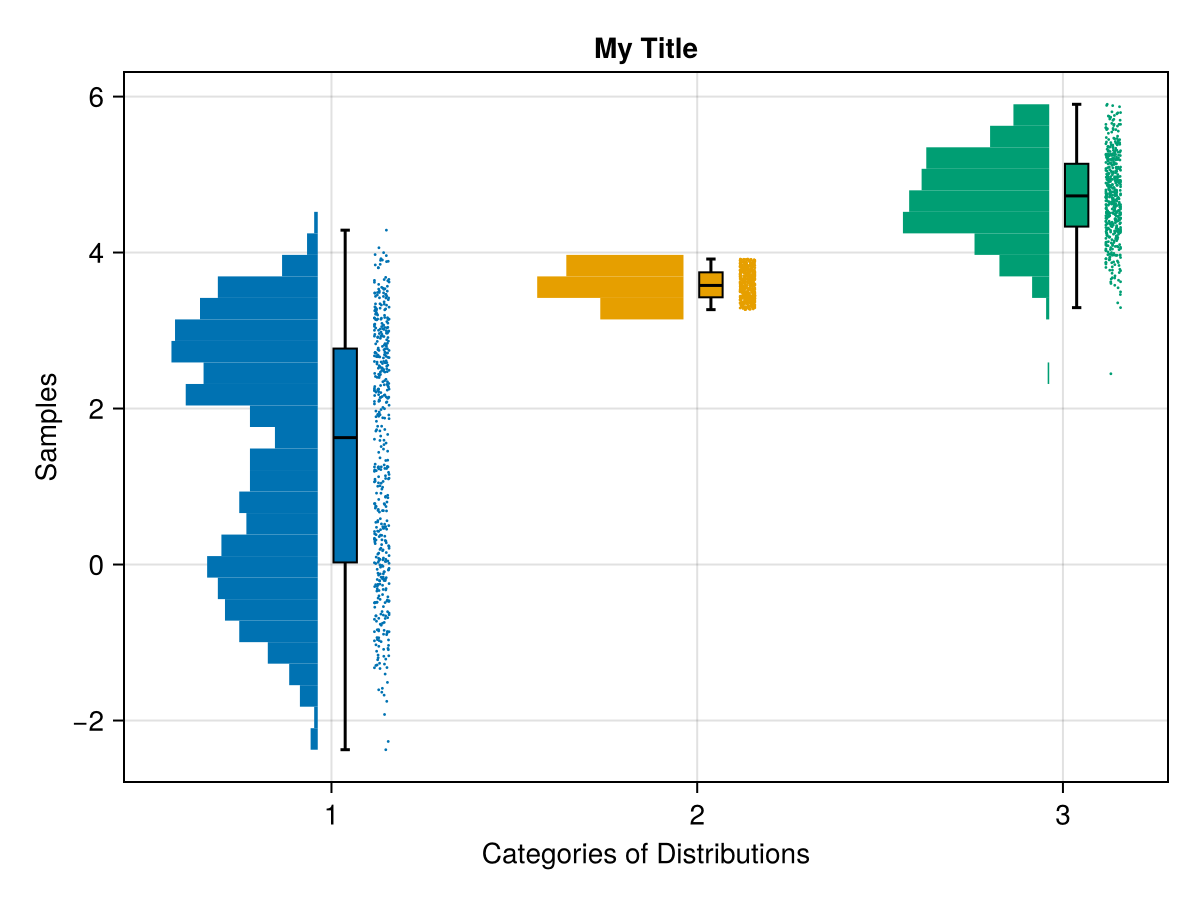
rainclouds(category_labels, data_array;
    axis = (;
        xlabel = "Categories of Distributions",
        ylabel = "Samples",
        title = "My Title"
    ),
    plot_boxplots = true, cloud_width=0.5, side = :right,
    violin_limits = extrema, color = colors[indexin(category_labels, unique(category_labels))])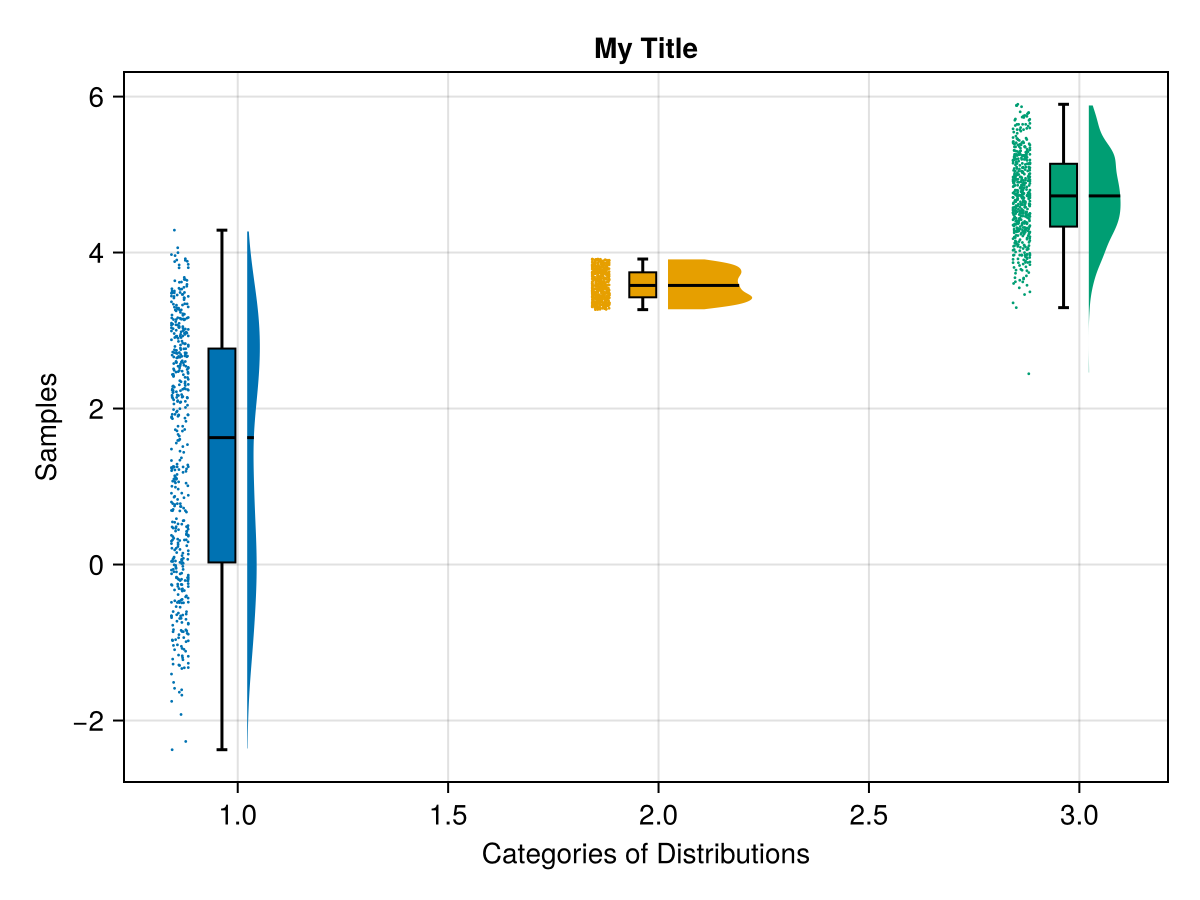
rainclouds(category_labels, data_array;
    axis = (;
        xlabel = "Categories of Distributions",
        ylabel = "Samples",
        title = "My Title",
    ),
    plot_boxplots = true, cloud_width=0.5, side = :right,
    color = colors[indexin(category_labels, unique(category_labels))])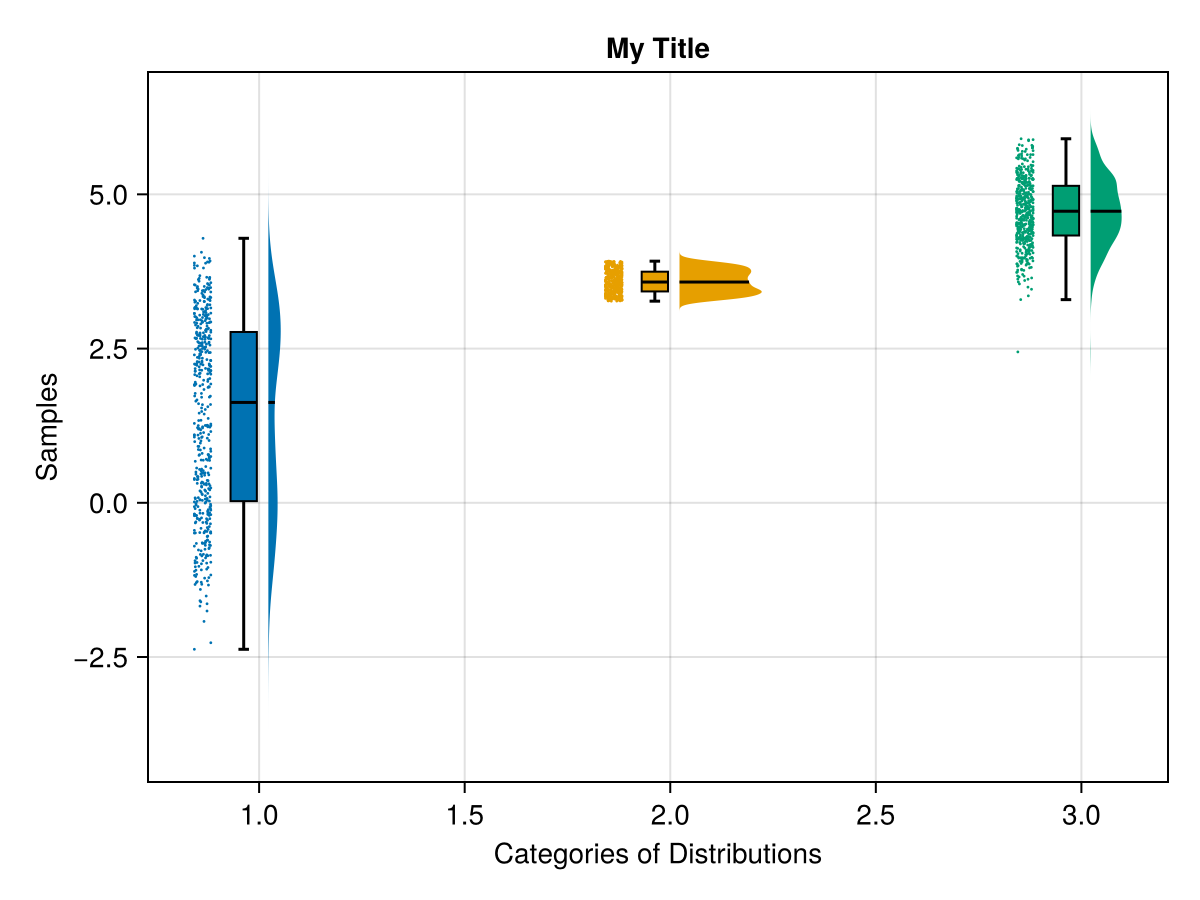
more_category_labels, more_data_array = mockup_categories_and_data_array(6)

rainclouds(more_category_labels, more_data_array;
    axis = (;
        xlabel = "Categories of Distributions",
        ylabel = "Samples",
        title = "My Title",
    ),
    plot_boxplots = true, cloud_width=0.5,
    color = colors[indexin(more_category_labels, unique(more_category_labels))])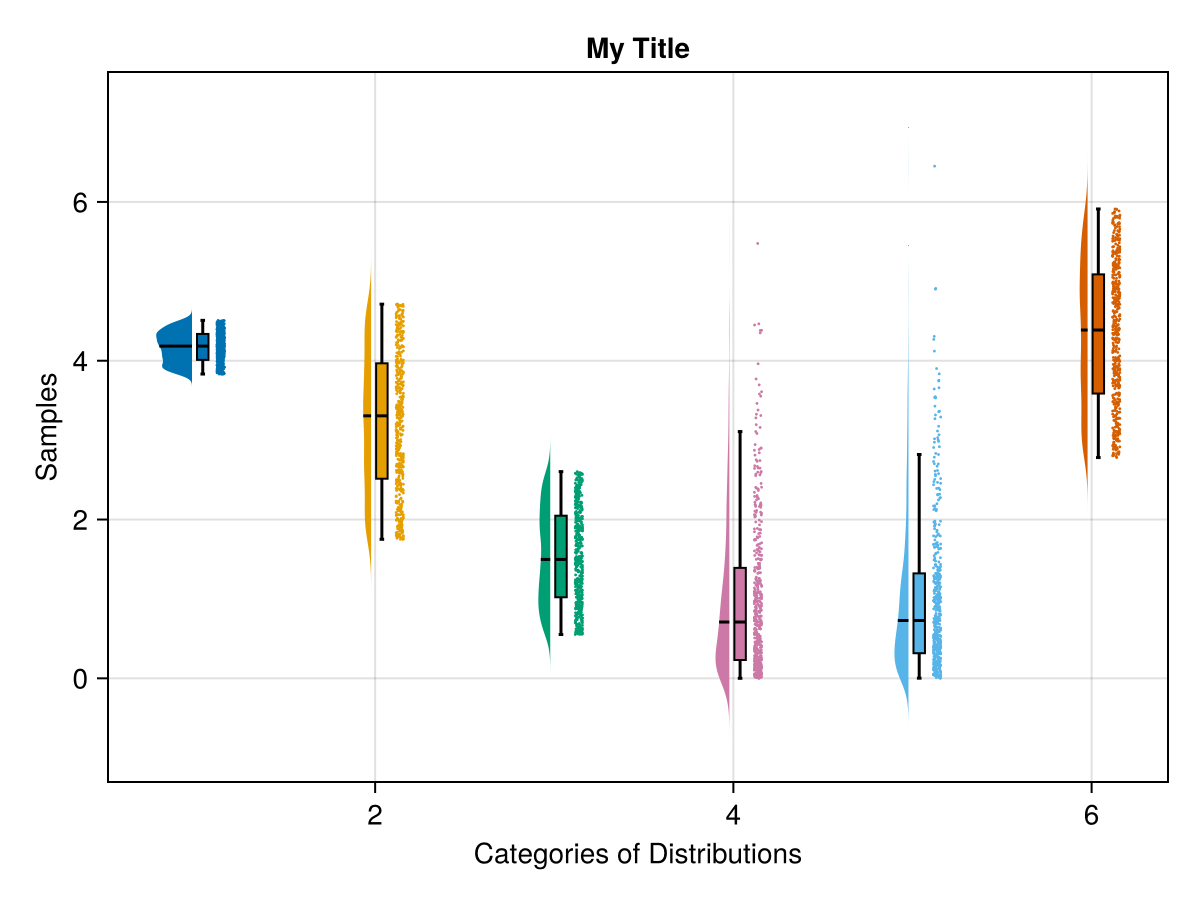
category_labels, data_array = mockup_categories_and_data_array(6)
rainclouds(category_labels, data_array;
    axis = (;
        xlabel = "Categories of Distributions",
        ylabel = "Samples",
        title = "My Title",
    ),
    plot_boxplots = true, cloud_width=0.5,
    color = colors[indexin(category_labels, unique(category_labels))])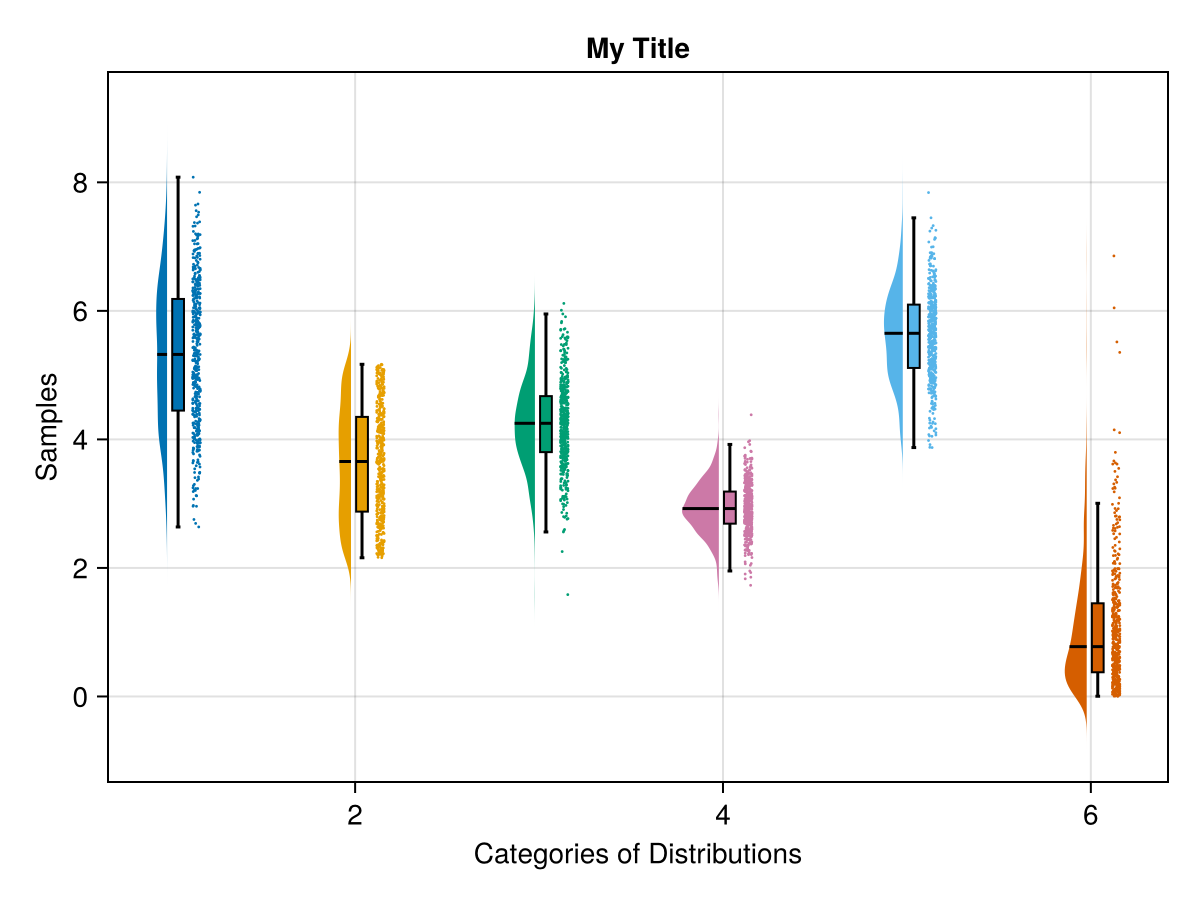
fig = Figure(size = (800*2, 600*5))
colors = [Makie.wong_colors(); Makie.wong_colors()]

category_labels, data_array = mockup_categories_and_data_array(3)
rainclouds!(
    Axis(fig[1, 1], title = "Left Side, with Box Plot"),
    category_labels, data_array;
    side = :left,
    plot_boxplots = true,
    color = colors[indexin(category_labels, unique(category_labels))])

rainclouds!(
    Axis(fig[2, 1], title = "Left Side, without Box Plot"),
    category_labels, data_array;
    side = :left,
    plot_boxplots = false,
    color = colors[indexin(category_labels, unique(category_labels))])

rainclouds!(
    Axis(fig[1, 2], title = "Right Side, with Box Plot"),
    category_labels, data_array;
    side = :right,
    plot_boxplots = true,
    color = colors[indexin(category_labels, unique(category_labels))])

rainclouds!(
    Axis(fig[2, 2], title = "Right Side, without Box Plot"),
    category_labels, data_array;
    side = :right,
    plot_boxplots = false,
    color = colors[indexin(category_labels, unique(category_labels))])

# Plots with more categories
# dist_between_categories (0.6, 1.0)
# with and without clouds

category_labels, data_array = mockup_categories_and_data_array(12)
rainclouds!(
    Axis(fig[3, 1:2], title = "More categories. Default spacing."),
    category_labels, data_array;
    plot_boxplots = true,
    gap = 1.0,
    color = colors[indexin(category_labels, unique(category_labels))])

rainclouds!(
    Axis(fig[4, 1:2], title = "More categories. Adjust space. (smaller cloud widths and smaller category distances)"),
    category_labels, data_array;
    plot_boxplots = true,
    cloud_width = 0.3,
    gap = 0.5,
    color = colors[indexin(category_labels, unique(category_labels))])

rainclouds!(
    Axis(fig[5, 1:2], title = "More categories. Adjust space. No clouds."),
    category_labels, data_array;
    plot_boxplots = true,
    clouds = nothing,
    gap = 0.5,
    color = colors[indexin(category_labels, unique(category_labels))])

supertitle = Label(fig[0, :], "Cloud Plot Testing (Scatter, Violin, Boxplot)", fontsize=30)
fig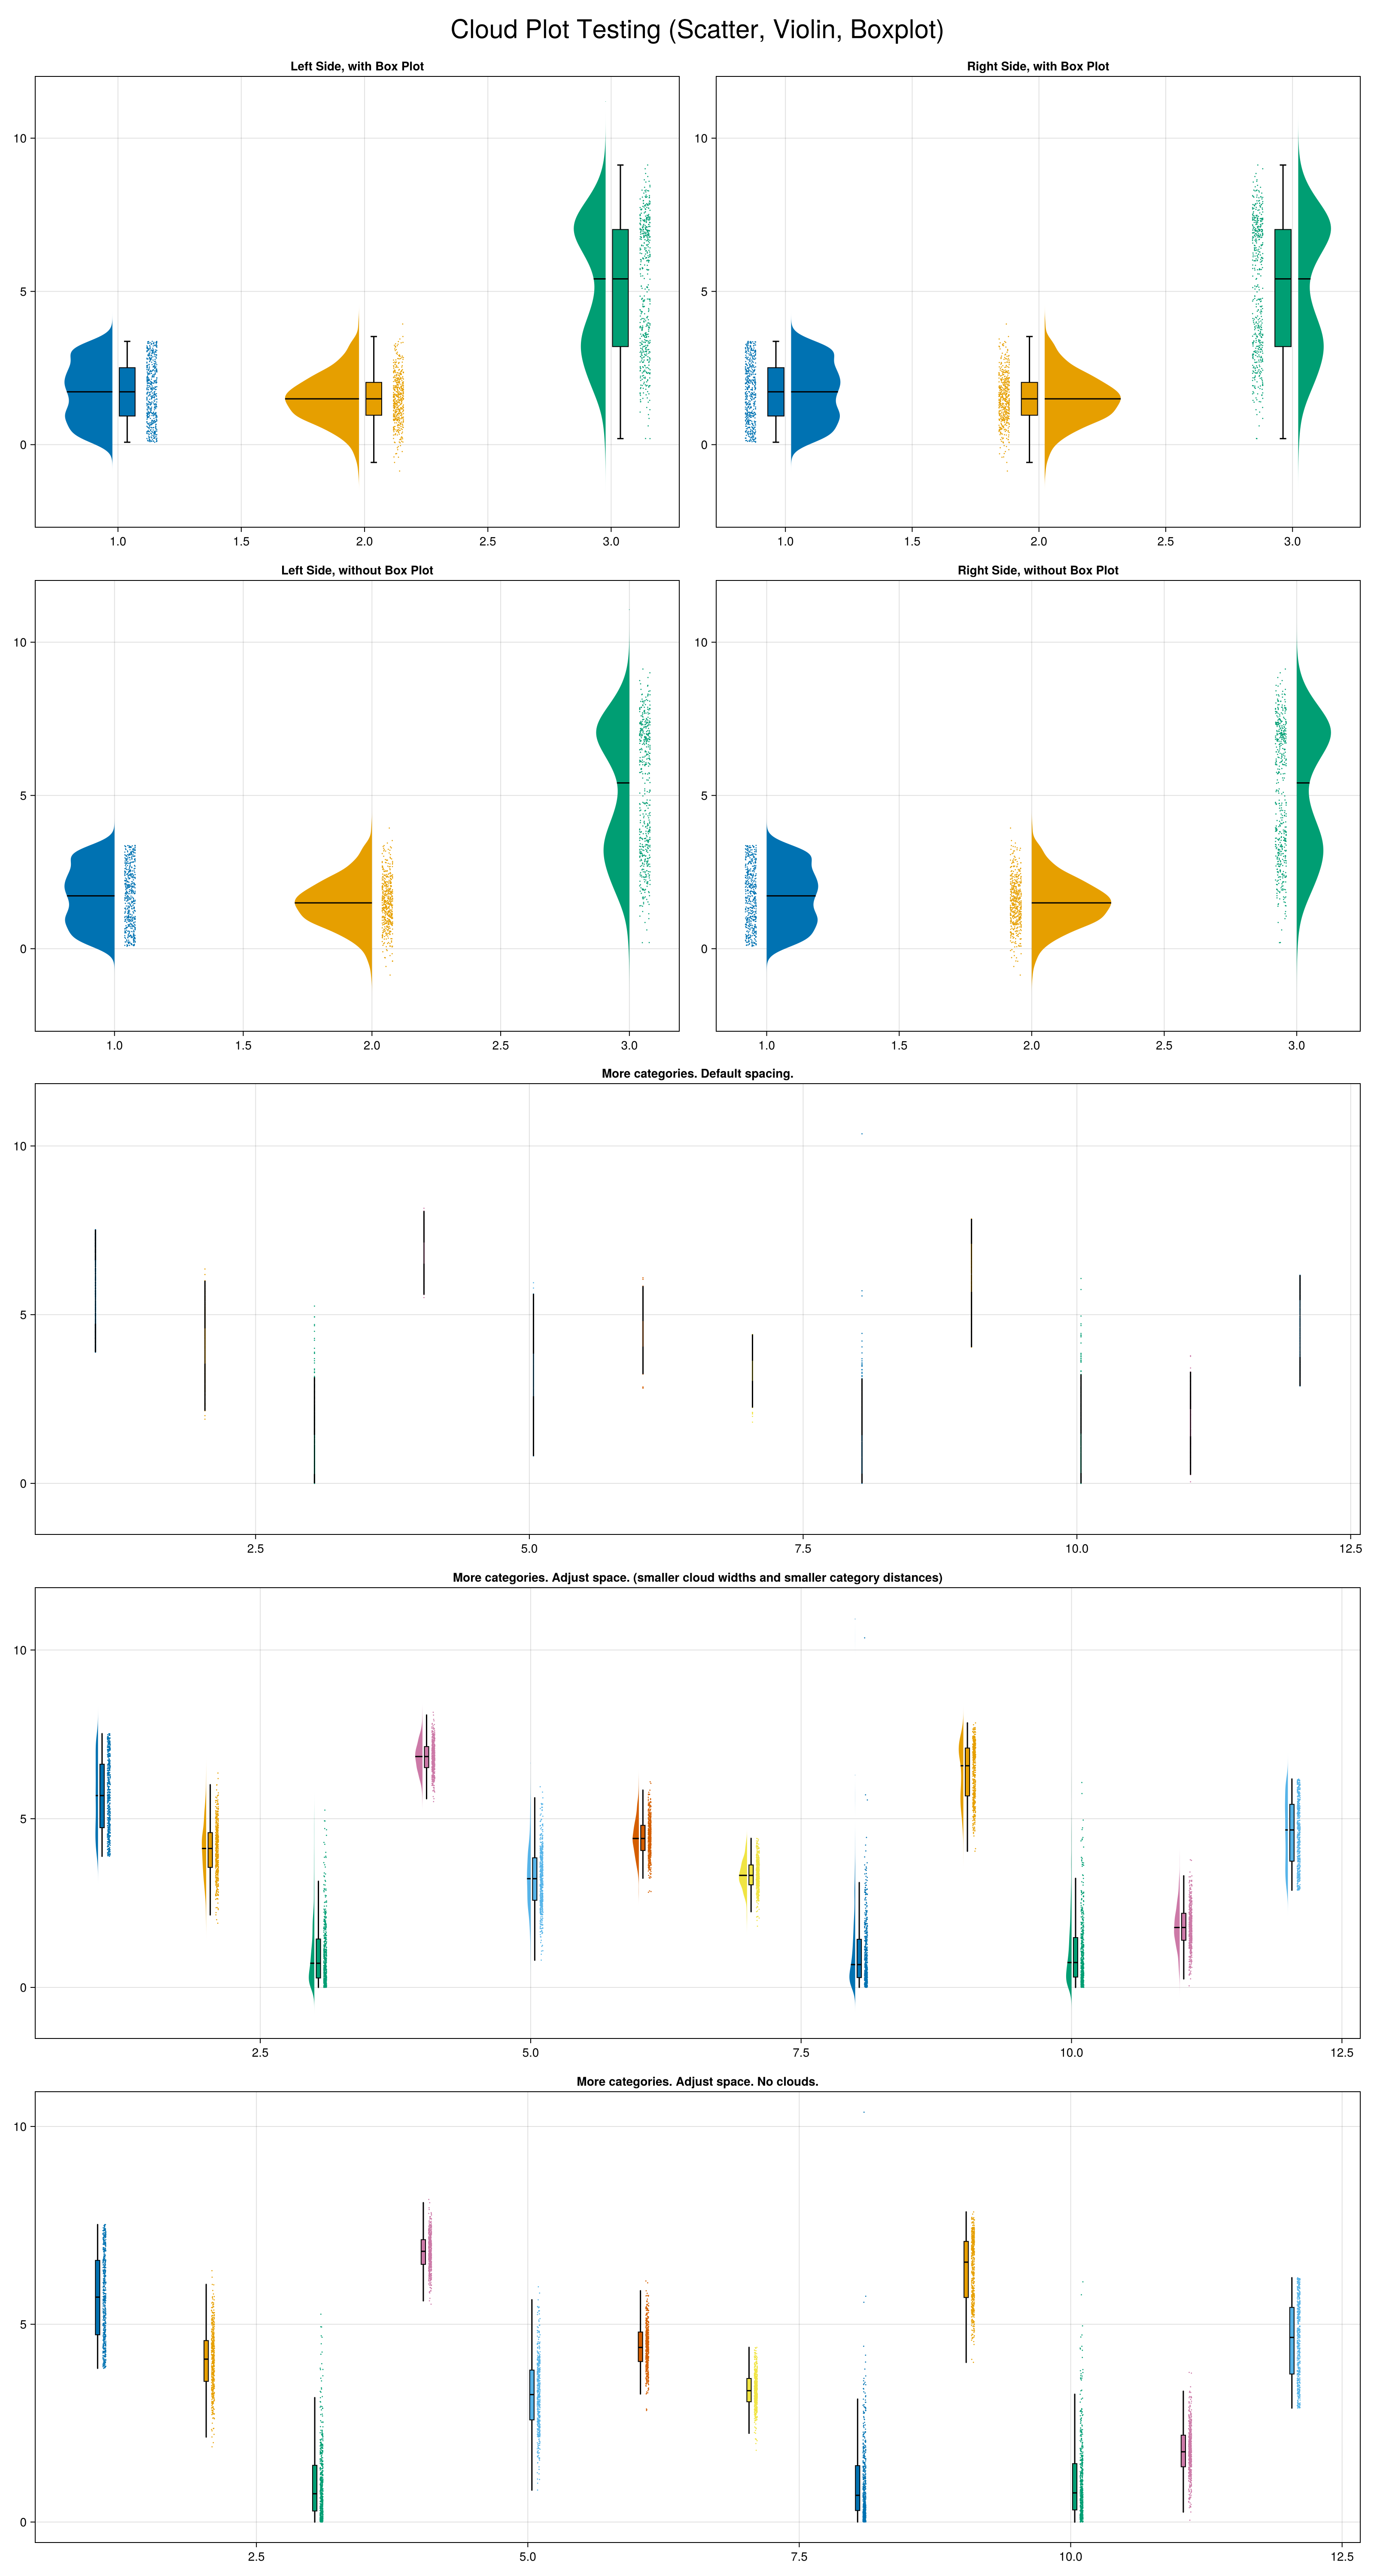
Attributes
boxplot_nudge
Defaults to 0.075
Determines the distance away the boxplot should be placed from the center line when center_boxplot is false. This is the value used to recentering the boxplot.
cloud_width
Defaults to 0.75
Determines size of violin plot. Corresponds to width keyword arg in violin.
clouds
Defaults to violin
[violin, hist, nothing] how to show cloud plots, either as violin or histogram plots, or not at all.
dodge
Defaults to automatic
Vector of Integer (length of data) of grouping variable to create multiple side-by-side boxes at the same x position
jitter_width
Defaults to 0.05
Determines the width of the scatter-plot bar in category x-axis absolute terms.
show_boxplot_outliers
Defaults to false
Show outliers in the boxplot as points (usually confusing when paired with the scatter plot so the default is to not show them)
show_median
Defaults to true
Determines whether or not to have a line for the median value in the boxplot.
side
Defaults to :left
Can take values of :left, :right, determines where the violin plot will be, relative to the scatter points
side_nudge
Defaults to automatic
Scatter plot specific. Default value is 0.02 if plot_boxplots is true, otherwise 0.075 default.