crossbar
|
The page is in the process of being translated. |
#
Makie.crossbar — Function
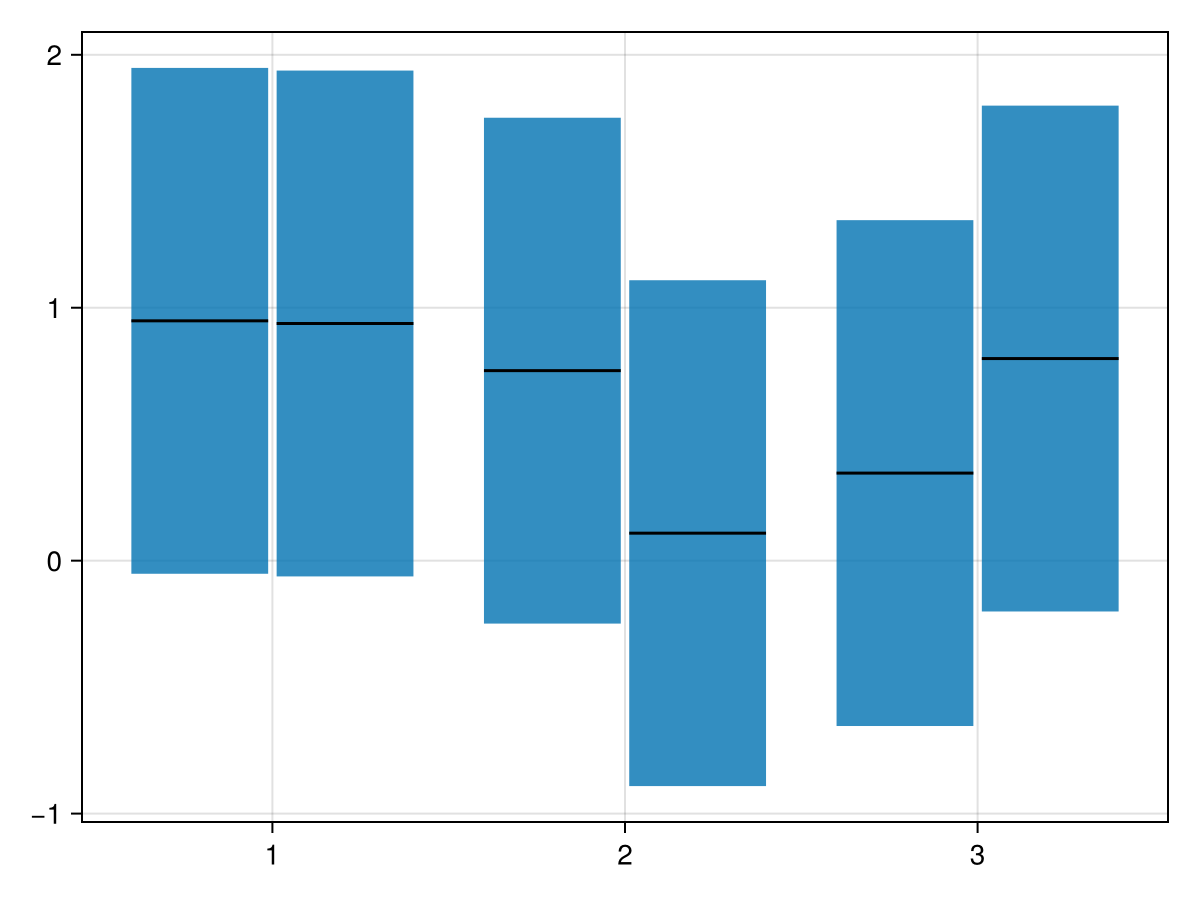
crossbar(x, y, ymin, ymax; kwargs...)Draw a crossbar. A crossbar represents a range with a (potentially notched) box. It is most commonly used as part of the boxplot.
Arguments
-
x: position of the box -
y: position of the midline within the box -
ymin: lower limit of the box -
ymax: upper limit of the box
Plot type
The plot type alias for the crossbar function is CrossBar.