bracket
|
The page is in the process of being translated. |
#
Makie.bracket — Function
bracket(x1, y1, x2, y2; kwargs...)
bracket(x1s, y1s, x2s, y2s; kwargs...)
bracket(point1, point2; kwargs...)
bracket(vec_of_point_tuples; kwargs...)
Draws a bracket between each pair of points (x1, y1) and (x2, y2) with a text label at the midpoint.
By default each label is rotated parallel to the line between the bracket points.
Plot type
The plot type alias for the bracket function is Bracket.
Examples
Scalar arguments
using CairoMakie
f, ax, l = lines(0..9, sin; axis = (; xgridvisible = false, ygridvisible = false))
ylims!(ax, -1.5, 1.5)

bracket!(pi/2, 1, 5pi/2, 1, offset = 5, text = "Period length", style = :square)

bracket!(pi/2, 1, pi/2, -1, text = "Amplitude", orientation = :down,
    linestyle = :dash, rotation = 0, align = (:right, :center), textoffset = 4, linewidth = 2, color = :red, textcolor = :red)

bracket!(2.3, sin(2.3), 4.0, sin(4.0),
    text = "Falling", offset = 10, orientation = :up, color = :purple, textcolor = :purple)

bracket!(Point(5.5, sin(5.5)), Point(7.0, sin(7.0)),
    text = "Rising", offset = 10, orientation = :down, color = :orange, textcolor = :orange,
    fontsize = 30, textoffset = 30, width = 50)
f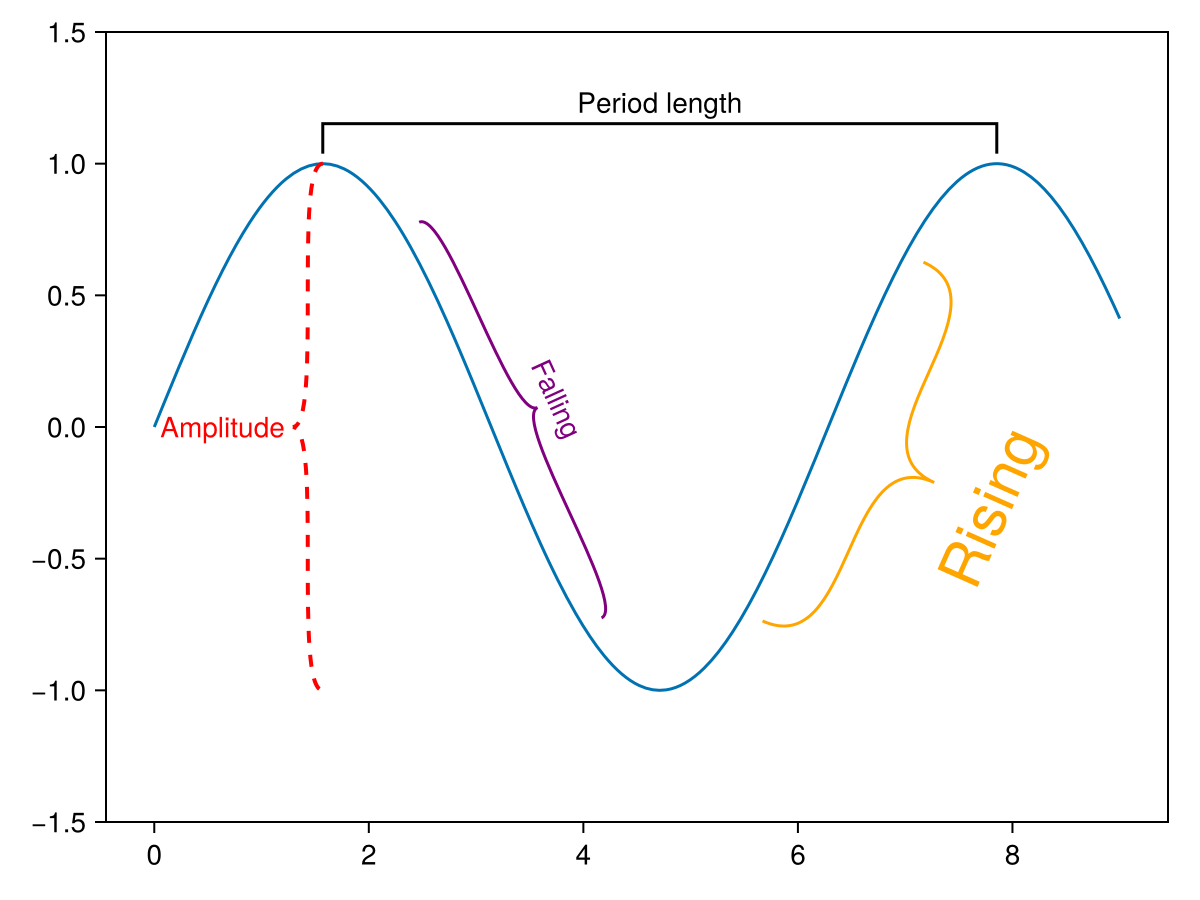
Vector arguments
using CairoMakie
f = Figure()
ax = Axis(f[1, 1])

bracket!(ax,
    1:5,
    2:6,
    3:7,
    2:6,
    text = ["A", "B", "C", "D", "E"],
    orientation = :down,
)

bracket!(ax,
    [(Point2f(i, i-0.7), Point2f(i+2, i-0.7)) for i in 1:5],
    text = ["F", "G", "H", "I", "J"],
    color = [:red, :blue, :green, :orange, :brown],
    linestyle = [:dash, :dot, :dash, :dot, :dash],
    orientation = [:up, :down, :up, :down, :up],
    textcolor = [:red, :blue, :green, :orange, :brown],
    fontsize = range(12, 24, length = 5),
)

f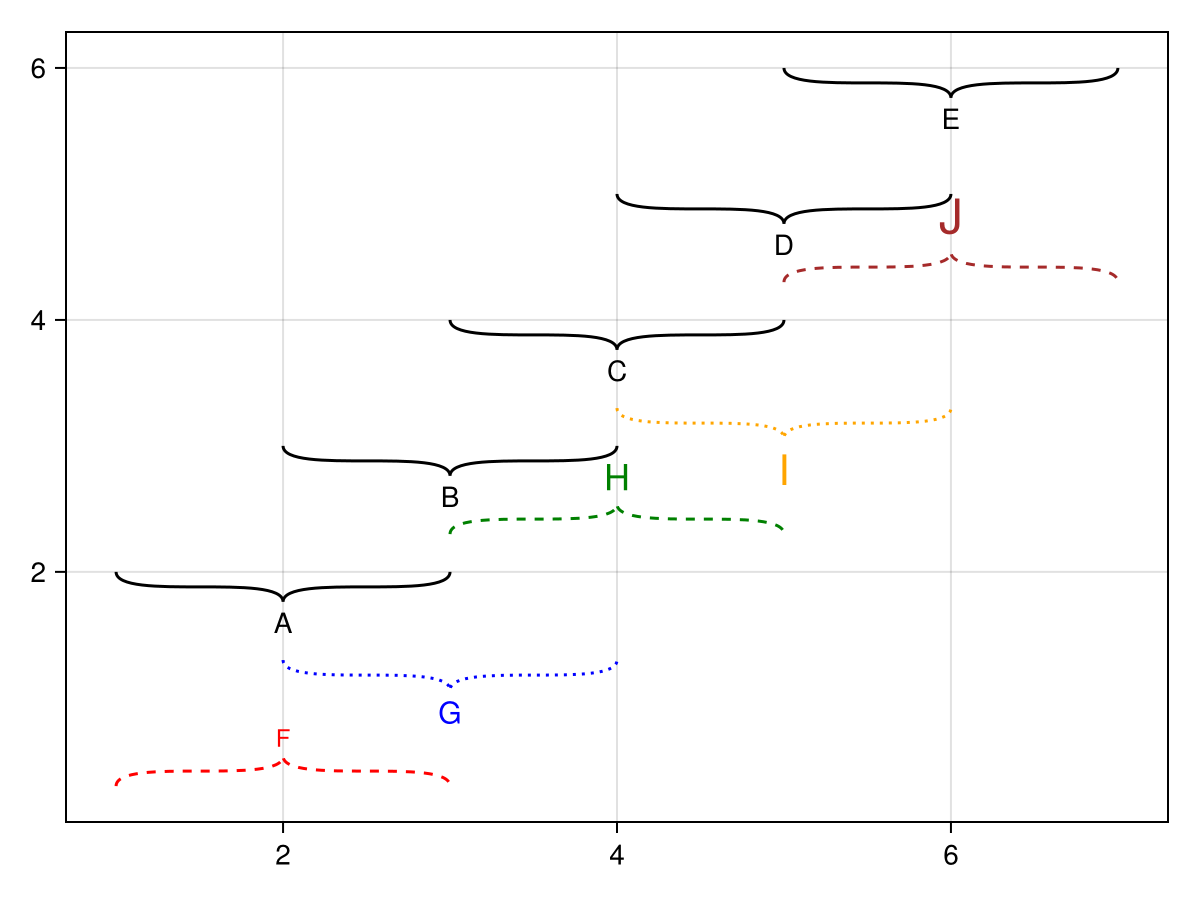
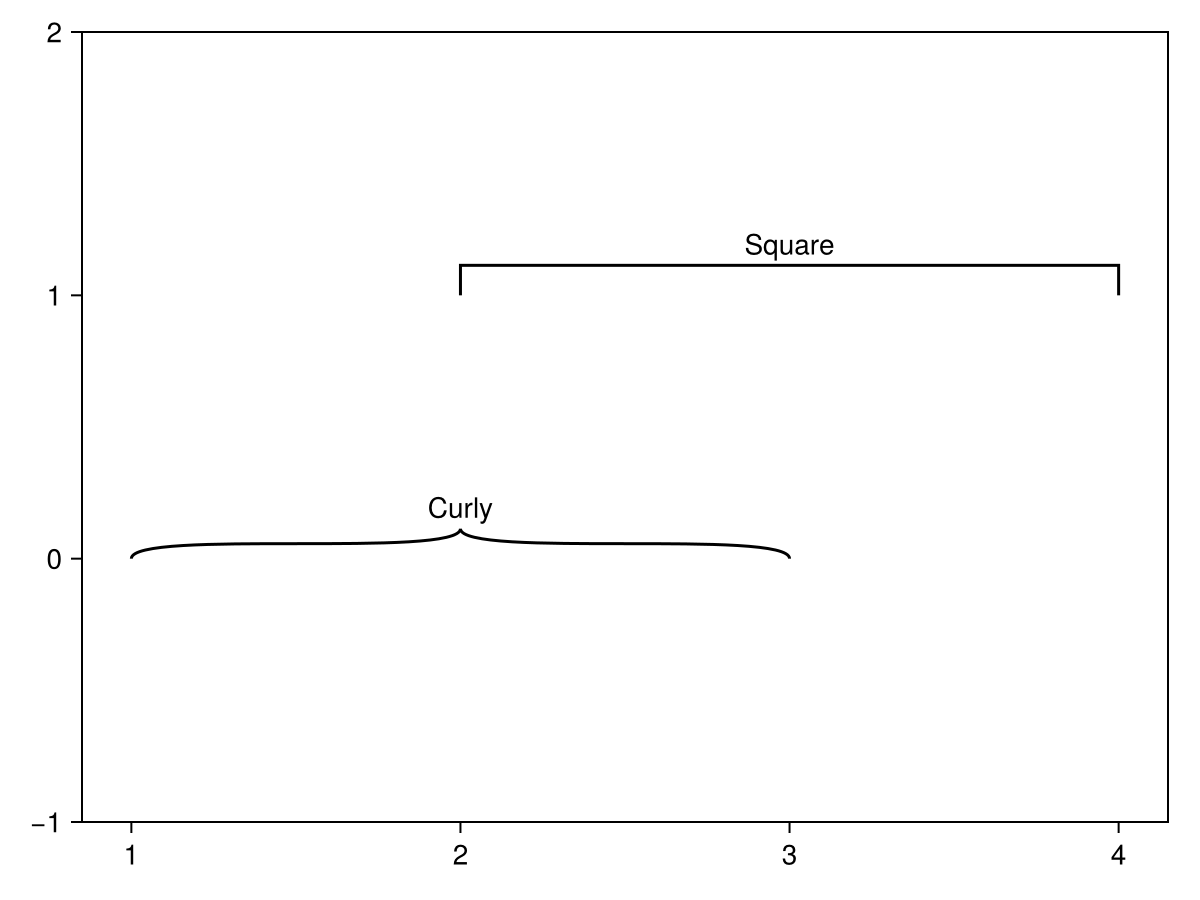
Styles
using CairoMakie
f = Figure()
ax = Axis(f[1, 1], xgridvisible = false, ygridvisible = false)
ylims!(ax, -1, 2)
bracket!(ax, 1, 0, 3, 0, text = "Curly", style = :curly)
bracket!(ax, 2, 1, 4, 1, text = "Square", style = :square)

f