Calculation of flow distribution in three-phase electric networks using blocks of the Engee physical modeling library
Engee can perform a load flow/power flow calculation for an alternating current (AC) electrical power transmission system modeled using a three-phase electrical domain Engee. The flow distribution calculation makes it possible to determine voltage modules, voltage phase angles, active power and reactive power of an electrical system in steady state.
For a given steady-state operating point, the flow distribution data shows:
-
Voltage modulus and phase angle of voltage on each bus;
-
Active and reactive generation power for each source feeding the network;
-
The active and reactive power supplied to each load that creates consumption in the network.
This data can be used to determine optimal operating modes or to evaluate the system’s response to hypothetical situations. For example, if the active and reactive capacities in each transmission line are known, it can be determined whether the remaining lines are able to withstand the additional load that occurs when one or more lines are disconnected.
This data can also be used to calculate transmission line losses or system losses and to analyze the overall voltage profile of the network. The study of these characteristics helps determine whether the system requires reactive power compensation to eliminate low voltage levels.
Requirements for the flow distribution calculation model
To determine a steady-state flow distribution solution for a three-phase network, the model must be:
-
It is set to start from the sinusoidal steady state. For more information, see the description of the block. Solver Configuration.
-
All sinusoidal sources must operate at the same frequency.
-
Linear. The blocks must be described by linear systems of equations and have linear characteristics. Thus, models of synchronous and asynchronous machines, transformers with a nonlinear branch of magnetization, and semiconductor elements are not supported.
-
Load-balanced. The level of approximation of the flow distribution calculation depends on how balanced the system is and on the level of harmonics present.
Key blocks for calculating flow distribution
Tires
In an electric power transmission system, a bus is a vertical line connecting elements of the power system, such as generators, loads, and transformers. The tires are represented by a block Busbar in the section Connectors & References.
Three-phase voltage sources
Represent voltage sources using the block Load Flow Source from the library Sources. The Load Flow Source block defines either an idealized voltage source or a current-dependent voltage source. The source can include a series resistance (impedance), or it can act as a source for a swing, PV or PQ type bus.
Performing a flow distribution calculation
To analyze flow distribution data for a three-phase transmission system model in Engee compatible with steady-state sinusoidal start-up:
-
Parameterize the voltage sources.
At the beginning of the flow distribution calculation, the variables of the equations corresponding to losses in transmission lines are unknown. While unknown variables are being calculated, the tires balance losses by giving or absorbing active and reactive power. For each node with a voltage source Load Flow Source there are four variables:
-
— active power;
-
— reactive power;
-
— tension;
-
— phase angle.
Two variables are known, and two are unknown. Which variables are known and which are unknown depends on the configuration of the Load Flow Source block. You can use more than one type of nodes in one model. The following options are available:
-
Swing bus — balancing (basic/swing/slack/reference) node. The voltage is set in the node (typical value
1O.E.), voltage angle accepted as equal0°, and the values of the active and reactive The capacities are unknown and are calculated during the steady state calculation. -
PV bus — generator node. The voltage module is set in the node and the value of the generated active power , and the voltage angle and reactive power They are unknown and are calculated during the steady state calculation.
-
PV bus — load node. The node is set to active and reactive power, and the voltage module and the voltage angle They are unknown and are calculated during the steady state calculation.
-
-
-
Configure each Busbar block:
-
Set the Number of connections parameter to
2,3or4. -
In the Busbar units, set the voltage and frequency so that they correspond to the set values of the connected units.
-
To view the flow distribution data using the block Scope, open access to additional measuring ports on the Busbar unit:
-
To open ports V and δ, set Measurement ports to
Yes; -
To open ports P and Q, set Measurement ports to
Yes.Connect the Busbar blocks.
-
-
-
Configure the Solver Configuration block. Enable the Start from steady state option.
-
Run the simulation.
After the simulation, the results of the flow distribution calculation can be viewed:
-
In the data, signals are recorded in Engee, which the model outputs to the Engee workspace;
-
In the table Physical variables
 displayed by clicking the Open list of physical variables button located in Settings → Debugging → Recording signals.
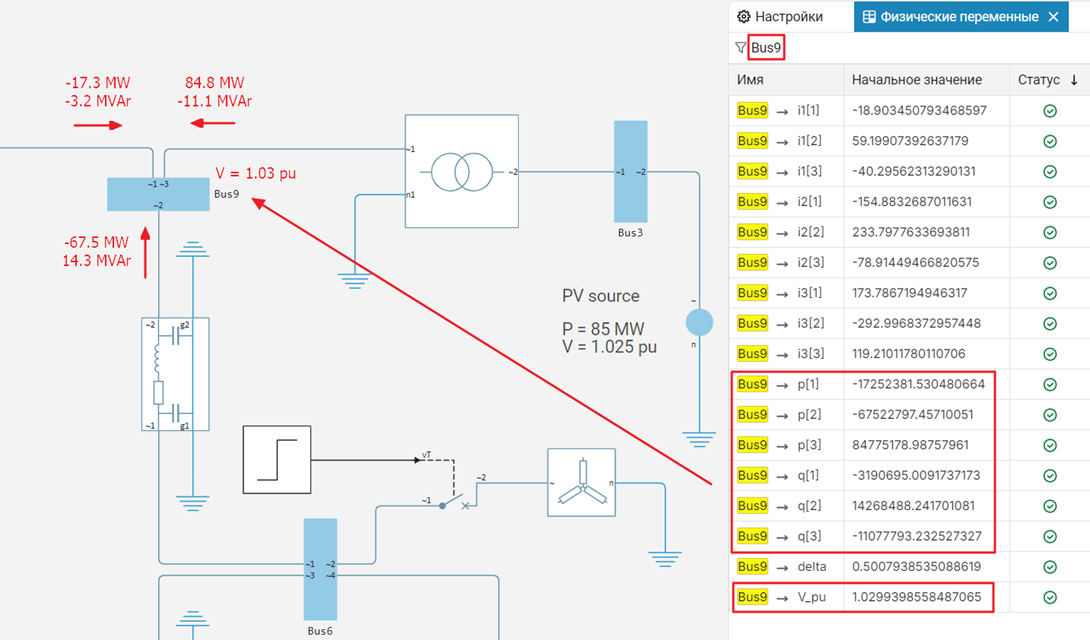
-
Troubleshooting flow distribution and initialization issues
If problems arise when calculating the flow distribution, apply the following measures. Step-by-step (incremental) testing of the flow distribution model helps to avoid setting non-physical calculation requirements.
Internal Resistance Load Flow Source
Adding the internal resistance of the source for the Load Flow Source block when the value is set in the Source type parameter Swing bus, PV bus or PQ bus it may interfere with the convergence of initialization. To eliminate convergence problems, use one of the methods:
-
Ignore the internal resistance of the source.
-
Simulate the internal resistance externally relative to the Load Flow Source block.
Suboptimal local minimum
The simulation may stop and generate an error if, in order to meet the active and reactive power requirements, optimization reduces the Busbar block voltage to a level at which the solution is closer to the undesirable local minimum near zero bus voltage than to the desired flow distribution solution. To prevent this situation, reconfigure the Load Flow Source blocks and increase the value of the Minimum voltage (pu) parameter (in the Expected Ranges settings).