Baseband modulation
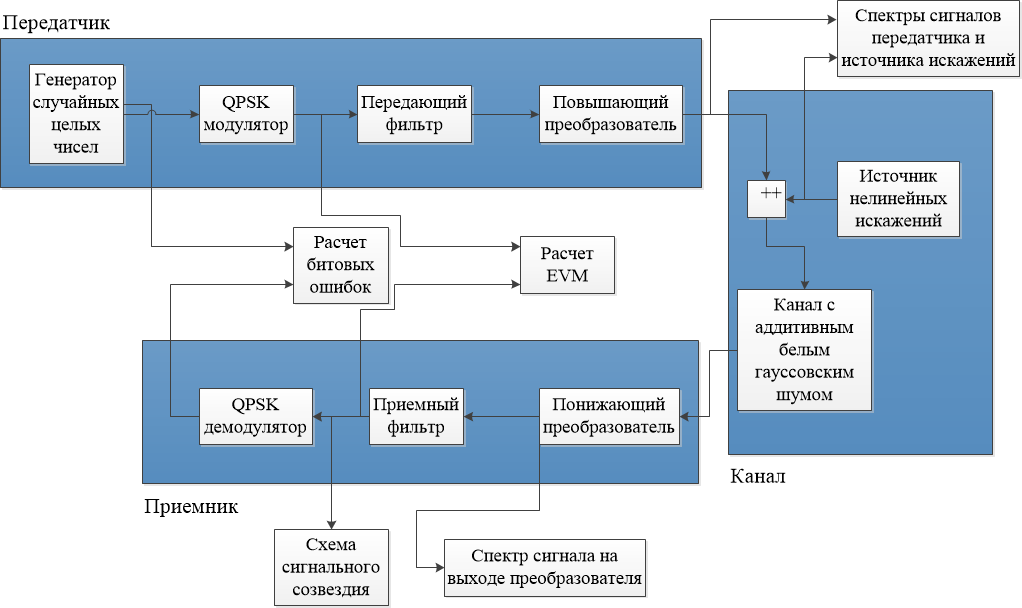
This example shows a simple way to perform baseband modulation by multiplying a modulated complex signal by a complex sine wave to perform frequency conversion with boost. It is preferable to model the system in a complex baseband. However, there are some circumstances in which it is necessary to simulate the system in real bandwidth. An example of this is when a signal from an adjacent frequency band is processed with non-linearity and causes interference in the desired frequency band.
The algorithm scheme looks like this:
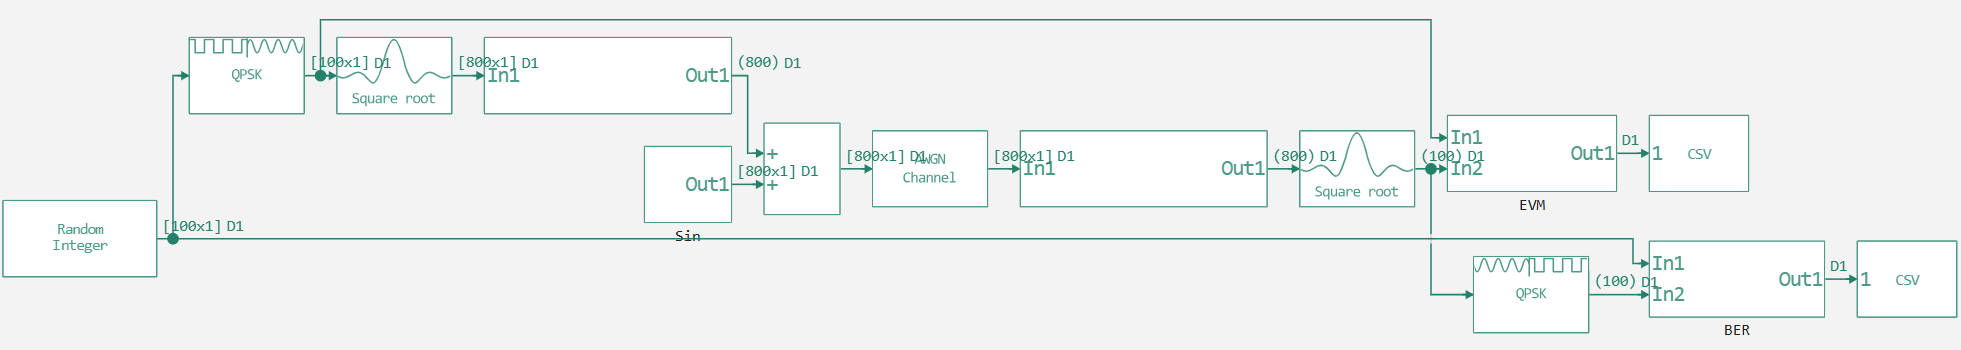
Building a model
Now let's look at the communication system model, which is a simulation of digital signal processing using Engee models.
Passbanmod
Interference with Nonlinearity
.png)
Upconverter
.png)
Downconverter
.png)
Calculate RMS EVM
.png)
Compute BER
.png)
function run_model( name_model, path_to_folder )

    Path = path_to_folder * "/" * name_model * ".engee"

    if name_model in [m.name for m in engee.get_all_models()] # Checking the condition for loading a model into the kernel
        model = engee.open( name_model ) # Open the model
        model_output = engee.run( model, verbose=true ); # Launch the model
    else
        model = engee.load( Path, force=true ) # Upload a model
        model_output = engee.run( model, verbose=true ); # Launch the model
        engee.close( name_model, force=true ); # Close the model
    end

    return model_output
end
# Launching the model
run_model( "passbandmod", @__DIR__ )
# Connecting libraries
using CSV, DataFrames
gr() # Enabling a backend method for displaying graphics
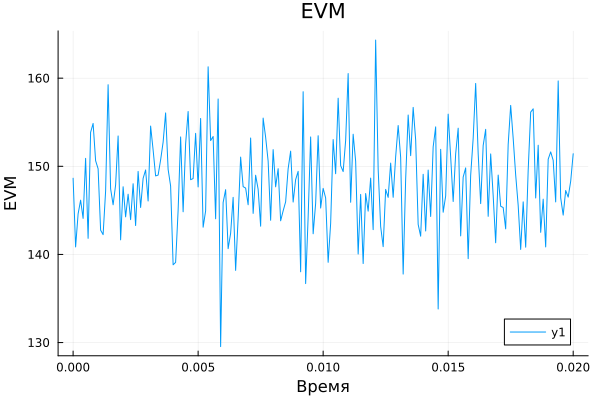
# # EVM
EVM = Matrix(CSV.read("$(@__DIR__)/EVM.csv", DataFrame)); # uploading data
plot(EVM[:,1], EVM[:,2], xlabel="Time", ylabel="EVM", title="EVM") # Plotting a graph
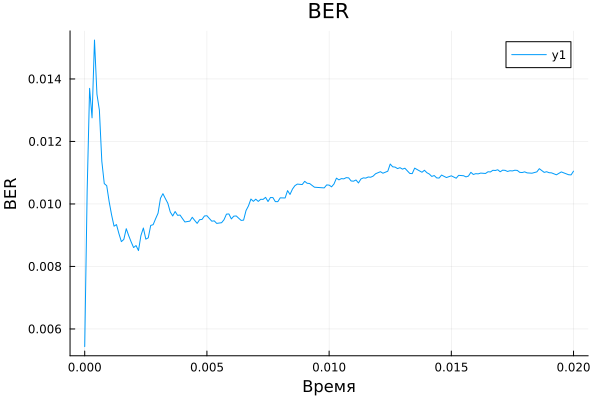
# # BER
BER = Matrix(CSV.read("$(@__DIR__)/BER.csv", DataFrame)); # uploading data
plot(BER[:,1], BER[:,2], xlabel="Time", ylabel="BER", title="BER") # Plotting a graph
Conclusion
We have implemented a model of a simple way to perform baseband modulation by multiplying a modulated complex signal by a complex sine wave to perform frequency conversion with an increase. They also showed how to use models for digital signal processing in Engee.