Tone Generator
DTMF is a two—tone multi-frequency analog signal, in other words, each symbol corresponds to a set of two frequencies.
Scope of application of tones: automatic telephone alarm between devices. In particular, such tones are used to control the connection between analog equipment.
DTMF implementation
Connecting libraries.
Pkg.add(["WAV", "DSP"])
using Plots
using FFTW
using DSP
using WAV
Declaring system parameters
# symbols = ["1", "5", "0", "8", "6", "4", "7", "7", "0", "0", "0"]; # Character set
symbols = ["5", "0", "8"]; # Character set
lfg = [697 770 852 941]; # Low frequency band
hfg = [1209 1336 1477];  # High frequency band
f = [reshape(ones(3, 1) * lfg, 1, 12); repeat(hfg, 1, 4)];
Fs = 8000;       # Sampling rate 8 kHz
N = 800;        # The duration of the key is 100 ms
t = [0:N-1;] ./ Fs; # 800 samples per Fs
pit = t * 2 * pi;
tones = zeros(N, length(symbols));
Filling in the keys
for i = 1:length(symbols)
    if symbols[i] == "1"
        tones[:, i] = sum(sin.(f[:, 1] * pit'), dims=1)'
    elseif symbols[i] == "2"
        tones[:, i] = sum(sin.(f[:, 2] * pit'), dims=1)'
    elseif symbols[i] == "3"
        tones[:, i] = sum(sin.(f[:, 3] * pit'), dims=1)'
    elseif symbols[i] == "4"
        tones[:, i] = sum(sin.(f[:, 4] * pit'), dims=1)'
    elseif symbols[i] == "5"
        tones[:, i] = sum(sin.(f[:, 5] * pit'), dims=1)'
    elseif symbols[i] == "6"
        tones[:, i] = sum(sin.(f[:, 6] * pit'), dims=1)'
    elseif symbols[i] == "7"
        tones[:, i] = sum(sin.(f[:, 7] * pit'), dims=1)'
    elseif symbols[i] == "8"
        tones[:, i] = sum(sin.(f[:, 8] * pit'), dims=1)'
    elseif symbols[i] == "9"
        tones[:, i] = sum(sin.(f[:, 9] * pit'), dims=1)'
    elseif symbols[i] == "*"
        tones[:, i] = sum(sin.(f[:, 10] * pit'), dims=1)'
    elseif symbols[i] == "0"
        tones[:, i] = sum(sin.(f[:, 11] * pit'), dims=1)'
    elseif symbols[i] == "#"
        tones[:, i] = sum(sin.(f[:, 12] * pit'), dims=1)'
    end
end
Setting pauses between keys.
    N8::Int64 = N / 8
    tones = [tones; 0.05 * randn(N8, length(symbols))];
    tones = [0.05 * randn(N8, 1); tones[:]];
Analysis of the results
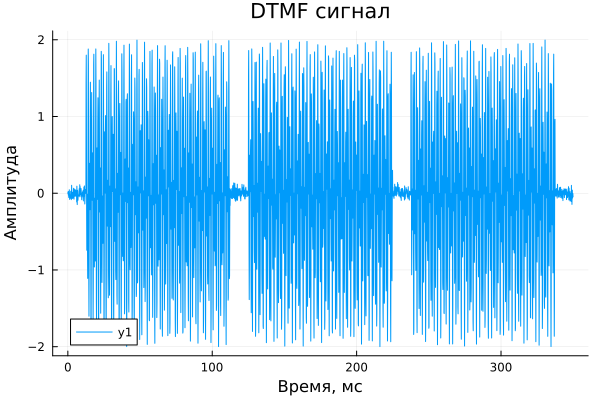
Let's plot the signal.
N = length(tones);
t = [0:N-1;] / Fs;
plot(1e3 * t, tones, xlabel="Time, ms", ylabel="The amplitude", title="DTMF signal")
Plotting the spectrum.
We will construct the spectrum using the fast Fourier transform.
Spec = 10 * log10.(abs.(fftshift(fft(tones)) ./ 1000) .^ 2);
freqs = fftshift(fftfreq(length(t), Fs))
plot(freqs, Spec, xlim=(650, 1500), xticks=650:100:1500, xlabel="Frequency, Hz", ylabel="Power, dB", title="DTMF signal spectrum")
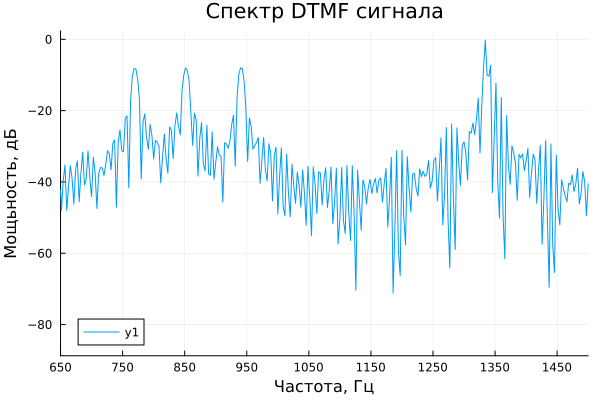
According to the graphs presented, it is difficult to clearly understand what the original set of characters was. For a more convenient representation, we will construct a spectrogram of the original signal.
spgr = DSP.spectrogram(tones[:,1], 255, 128; fs = Fs); # Creating a spectrogram of the original DTMF signal
Plots.heatmap(spgr.time.*1000, spgr.freq, pow2db.(spgr.power), xguide = "Time, ms", yguide = "Frequency, Hz",ylim =(500, 1500), yticks=650:100:1500)
It follows from the spectrogram that the character set was: 5,0,8.
Conclusion
As a result of the development of this example, you were shown the possibilities of implementing a tone generator in Engee, as well as the possibilities of visualizing modulated signals to perform convenient analysis of these signals.