Comparison of the effectiveness of communication systems with and without convolutional coding.
This article presents an analysis of improving the reliability characteristics of data transmission in digital communication systems using convolutional encoding and the Viterbi decoding algorithm. The research methodology is based on comparative modeling of two systems: the basic uncoded QPSK system and the QPSK system with convolutional encoding. The simulation results, expressed as bit error probability curves (BER), clearly demonstrate the significant gain in energy efficiency achieved through the use of noise-tolerant coding.
One of the key tasks in the design of communication systems is to ensure high reliability of information transmission under the influence of noise, interference and fading. A quantitative measure of the reliability of a system is the probability of a bit error (BER — Bit Error Rate), defined as the ratio of the number of mistakenly received bits to the total number of transmitted ones. The dependence of BER on the signal-to-noise ratio (SNR or Eb/N0) is a fundamental characteristic that makes it possible to estimate the required transmitter power to achieve the required communication quality.
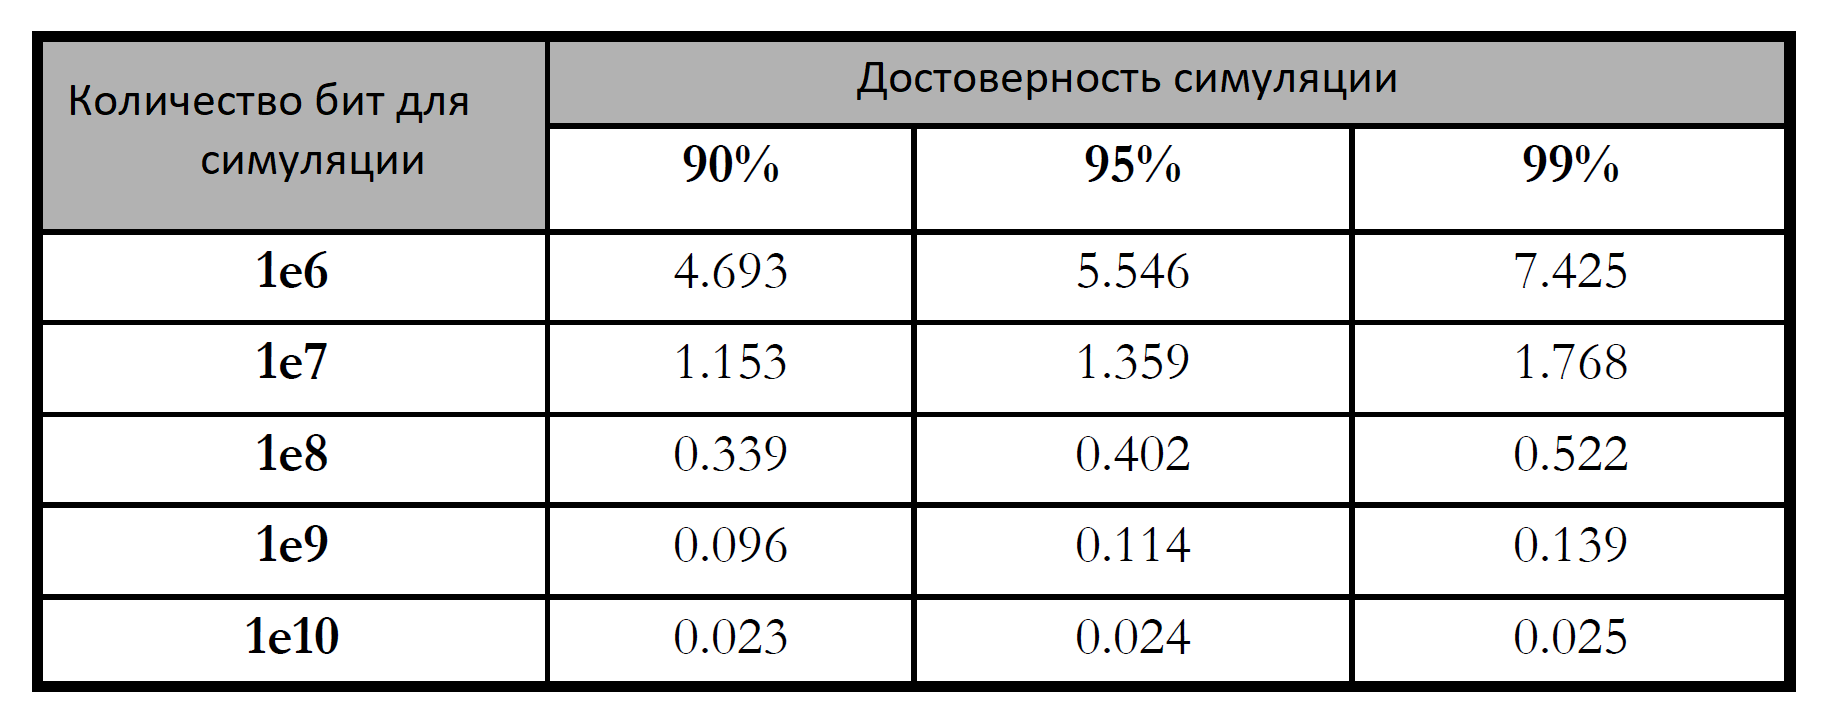
Direct modeling of the transmission of large amounts of data is a standard method for constructing such dependencies. To obtain statistically significant results, especially at low BER values (on the order of 10-6), modeling of tens or hundreds of millions of bits is required. This allows you to get an estimate with an acceptable confidence interval.
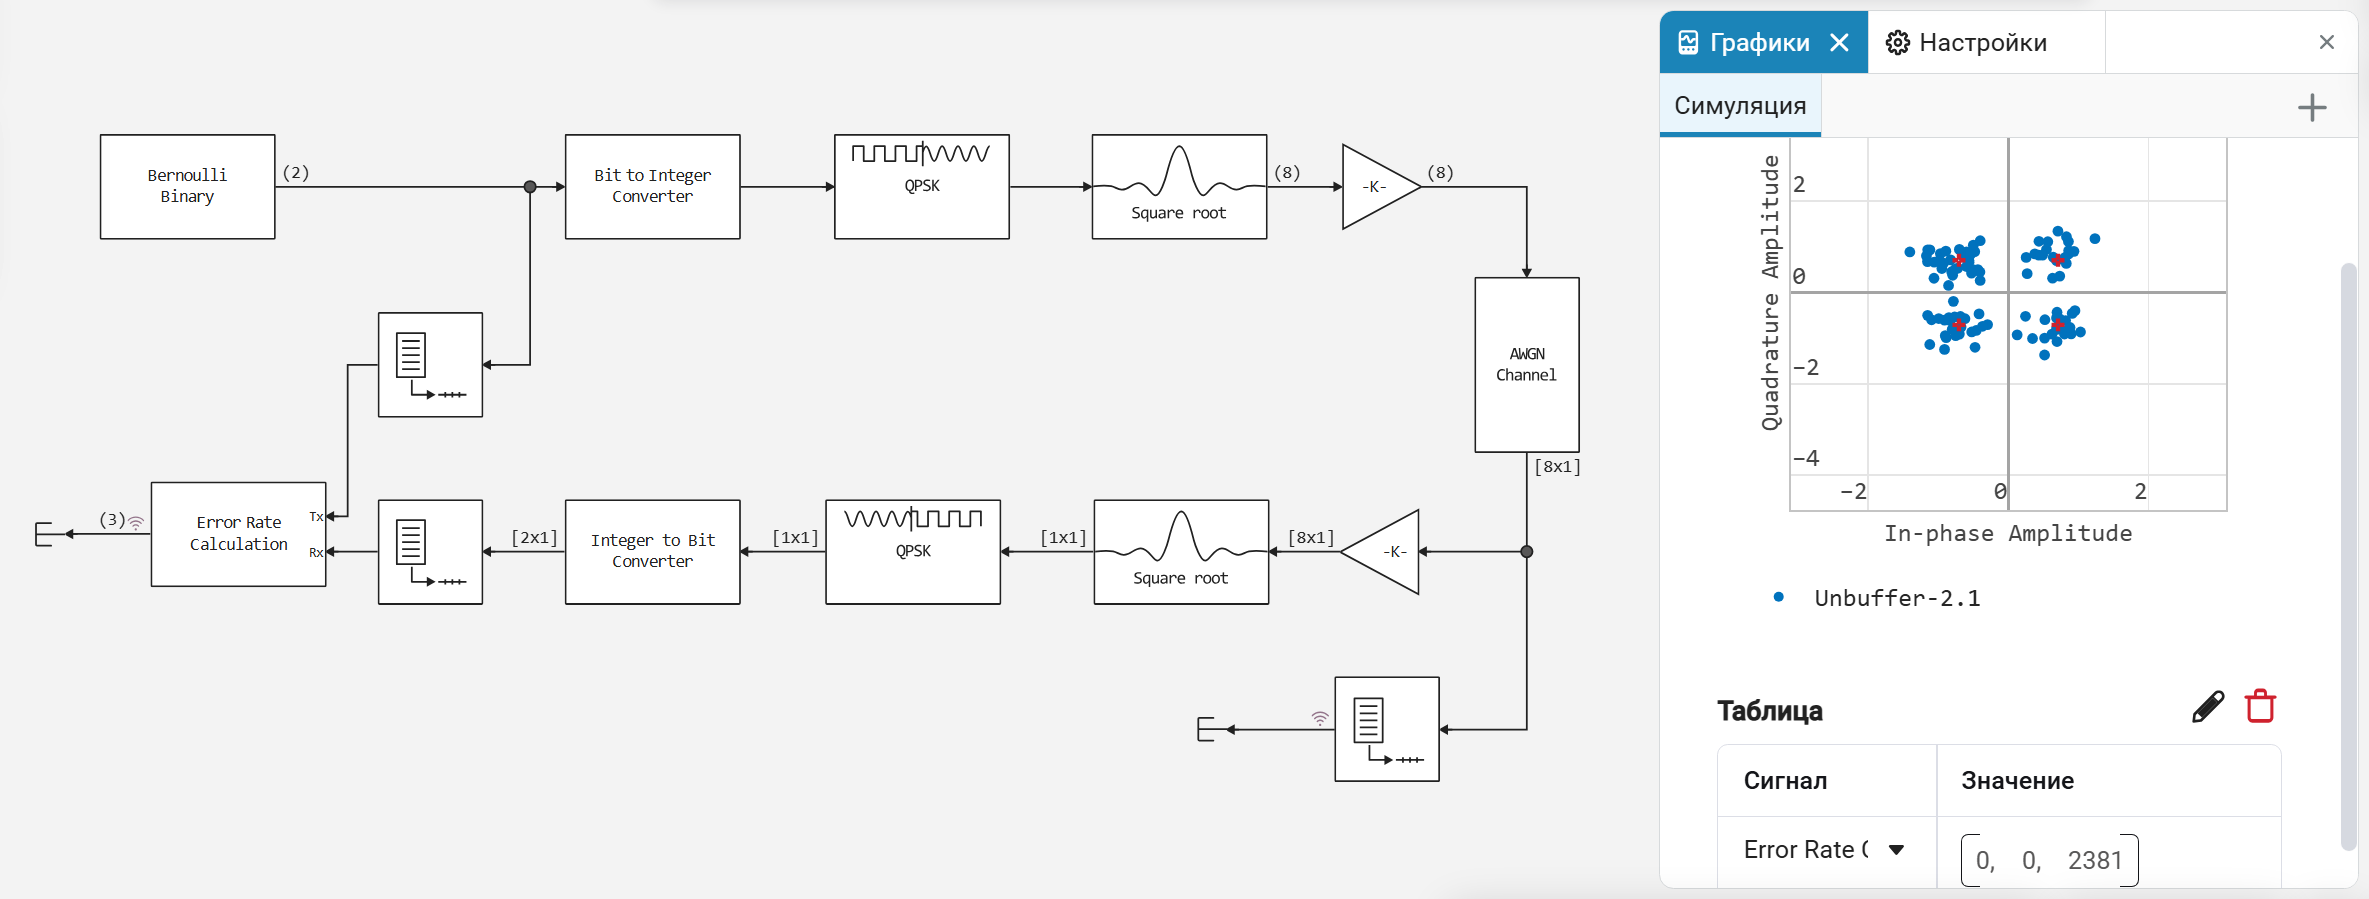
In this paper, a method for increasing noise immunity is investigated — channel convolutional encoding in combination with Viterbi decoding. The aim of the study is to quantify the energy gain achieved by using this type of coding in a QPSK (Quadrature Phase-Shift Keying) modulated channel with additive white Gaussian noise (AWGN).
model = engee.load("qpsk_ber.engee");
EbNo_vec = 0:10;
EbNo = 0;
BER_vec = zeros(length(EbNo_vec))
for (i,EbNo1) in enumerate(EbNo_vec)
    EbNo = EbNo1;
    engee.run(model);
    BER_vec[i] = [x[1] for x in collect(BER).value][end];
end
plot(EbNo_vec, BER_vec,
    yaxis=:log10,  # Logarithmic scale on the Y axis
    label="QPSK",
    xlabel="EbNo (dB)",
    ylabel="BER",
    title="BER Curve",
    grid=true,
    legend=:topright,
    yticks=10.0.^(-5:1:0),  # Adding ticks from 1e-5 to 1
    ylims=(1e-5, 1))  # Setting the limits of the Y-axis
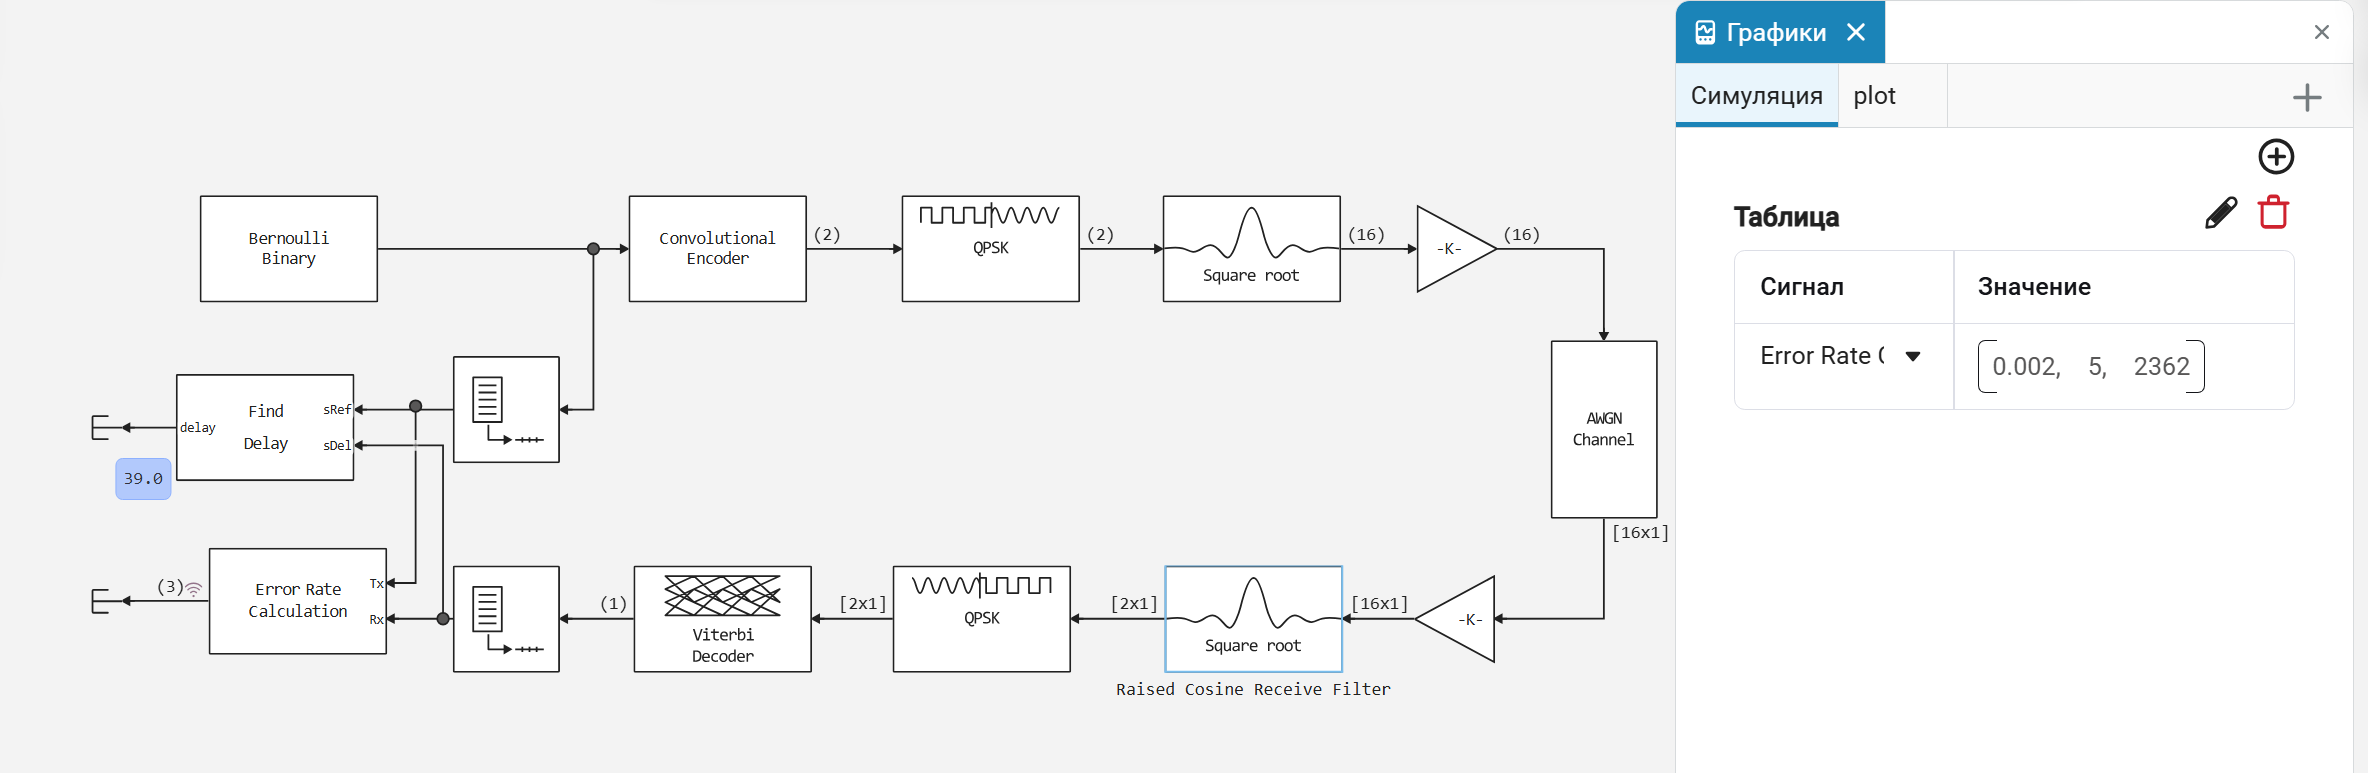
The following is an improved scheme, which includes noise-resistant encoding and decoding units. The information bits pass through the convolutional encoder before being modulated, which increases the redundancy of the transmitted stream. On the receiving side, the convolutional decoder (Viterbi) uses the grid structure of the code to correct errors that have occurred in the channel. This model used hard decoding, and Gray code mapping was used to match bits and phases of modulator symbols to minimize errors with adjacent symbols.
The convolutional encoder was set using the function poly2trellis, defining its structure in terms of the length of the code constraint and generating polynomials. It is important to note that the identical lattice structure was set for both the encoder and the Viterbi decoder.
A BER curve was constructed for each of the systems depending on the energy ratio Eb/N0 (in dB). The Eb/N0 range for the uncoded system ranged from 1 to 8 dB, and for the encoded system from 1 to 6 dB. The results are presented on a combined graph.
model_uncoded = engee.load("qpsk_ber.engee");
model_coded = engee.load("qpsk_coded_ber.engee");
EbNo_vec = 1:8;
BER_vec = zeros(length(EbNo_vec))
for (i,EbNo1) in enumerate(EbNo_vec)
    EbNo = EbNo1;
    engee.run(model_uncoded);
    BER_vec[i] = [x[1] for x in collect(BER).value][end];
end
plot(EbNo_vec, BER_vec,
    yaxis=:log10,  # Logarithmic scale on the Y axis
    label="QPSK is uncoded",
    xlabel="EbNo (dB)",
    ylabel="BER",
    title="BER Curve",
    grid=true,
    legend=:topright,
    yticks=10.0.^(-5:1:0),  # Adding ticks from 1e-5 to 1
    ylims=(1e-5, 1))  # Setting the limits of the Y-axis
EbNo_vec = 1:6;
BER_vec = zeros(length(EbNo_vec))
for (i,EbNo1) in enumerate(EbNo_vec)
    EbNo = EbNo1;
    engee.run(model_coded);
    BER_vec[i] = [x[1] for x in collect(BER).value][end];
end
plot!(EbNo_vec, BER_vec,
    label="QPSK encoded")
Graph analysis allows us to draw the following conclusions:
-
Uncoded system: The BER curve for classical QPSK demonstrates the expected exponential dependence. An Eb/N0 of about 6.5 dB is required to achieve a BER of 10^-4.
-
Coded system: The BER curve for a system with convolutional encoding and Viterbi decoding is located significantly lower. This means that to achieve the same BER value (for example, 10^-4), an encoded system requires a significantly lower Eb/N0 ratio — by about 3-4 dB.
-
Coding gain: The gap between the curves observed on the graph is a visual representation of coding gain. In practice, this means that a convolutional coding system can either operate with the same BER at lower transmitter power (energy savings), or provide much higher reliability of communication (lower BER) at the same power as an uncoded system.
Conclusion
The simulation clearly confirmed the high efficiency of using convolutional coding in combination with the Viterbi algorithm to increase the noise immunity of digital communication systems.
Thus, the use of convolutional codes and the Viterbi decoder is a powerful and practically significant tool in the design of modern communication systems, where the requirements for energy efficiency and reliability of data transmission are constantly increasing. The resulting BER curves serve as an important tool for a system engineer when calculating the communication line budget and selecting transmission parameters.