What’s new in 0.5.0
Maths environment
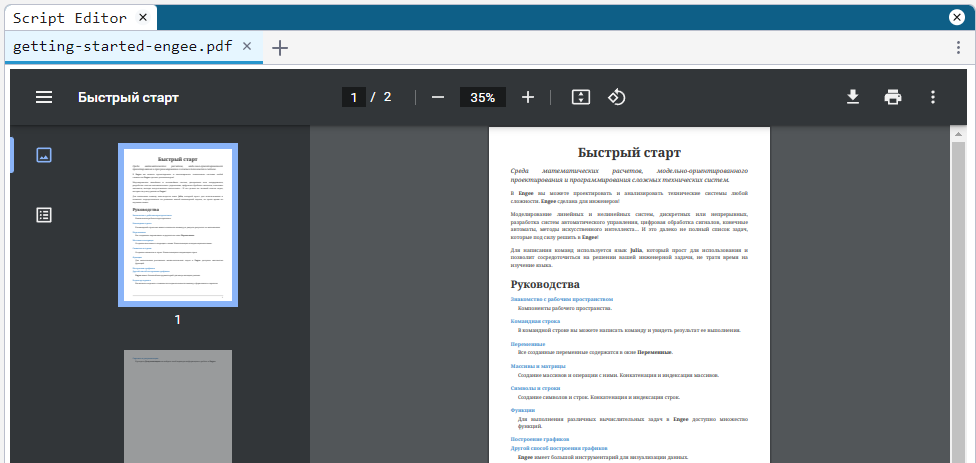
Added PDF viewer, bitmap viewer and ability to view and edit markdown files
Now you don’t have to download images and PDFs from submitted examples and courses to view them.
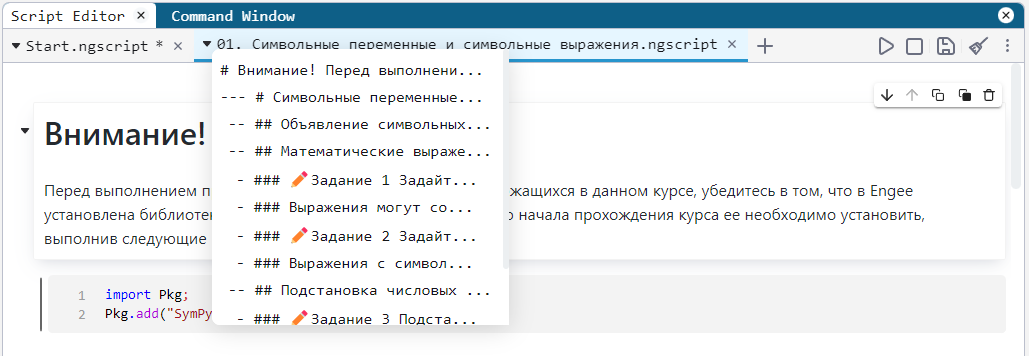
Added paragraph tree navigation
You can display the tree of paragraphs by clicking on the corresponding icon on the script tab and quickly jump to the required paragraph.
Added script navigation from the status bar
Clicking on the status bar takes you to the active or executable cell. This is useful for large interactive scripts or long calculations.
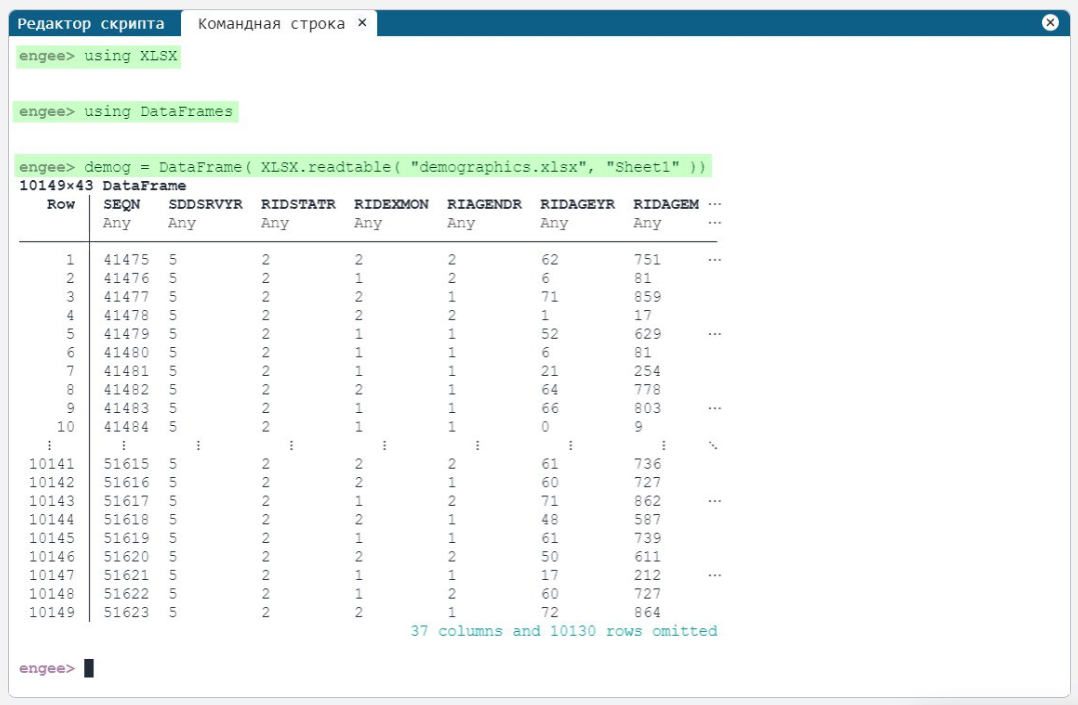
Added possibility to choose the location of function output
To make your code more readable and clear, you can choose where to place the function output: on the right side, at the bottom or hide it altogether.
Drag & Drop - downloading files from your computer with the mouse
Now you can drag and drop scripts or data files from your PC directly into your browser with Engee open. Classic button upload is also available.
Added keyboard navigation of interactive scripts
For some of us, scrolling through sections of an interactive script with the arrows is more familiar than scrolling.
Corrected the behaviour of Ctrl+C in the command line
If text is selected in the terminal, Ctrl+C copies the text. If no text is selected in the terminal, Ctrl+C sends an interrupt signal to code execution. At one time supported paste from memory via Ctrl+V, and CMD+V for macOS fans.
| If your browser doesn’t allow pasting via Ctrl+V, try pressing this keyboard shortcut twice. In most browsers, this opens the paste permission dialogue box. |
Images in text cells
The image code is now displayed concisely when added to the script, rather than base64. It’s much more convenient to edit the source code of text cells this way, and the display is as nice as it was.
Inserting images into scripts from clipboard
We have added the ability to load images into a script not through the load button, but through the context menu or keyboard shortcut. This will speed up the workflow and make it more intuitive.
Little things for your convenience:
-
Added tab controls via context menu.
-
Added scrolling to a new cell when creating it.
Modelling environment
Added support for vectorisation and matrix mode for some blocks
Long-awaited functionality, which is important for development of algorithms with stream processing (digital signal processing, image processing, video processing, radar). Allows to speed up models, make them clearer and more reliable.
Signal visualisation tool in the frequency domain
Model signals can now be visualised in both time and frequency domain. The visualisation module supports both axis display mode switching and the ability to display the same signal on separate axes in spectral analyser mode.
Tool for visualising the dependence of one signal on another
Sometimes you need to plot the dependence of a signal not on time, but relative to another signal. Now you can plot constellations of communication systems, torque vs velocity dependence, phase portraits of systems, volt-ampere characteristics of semiconductors, flow characteristics of hydraulics and much more. If your signal is vector, we have given you the option to choose which signals you want to use in the graph.
Added tabs in the Charts module
You can save display settings for each model (for example, time domain for one graph and frequency domain for another). You can create and name graph tabs to save the desired view for analysing or demonstrating a model.
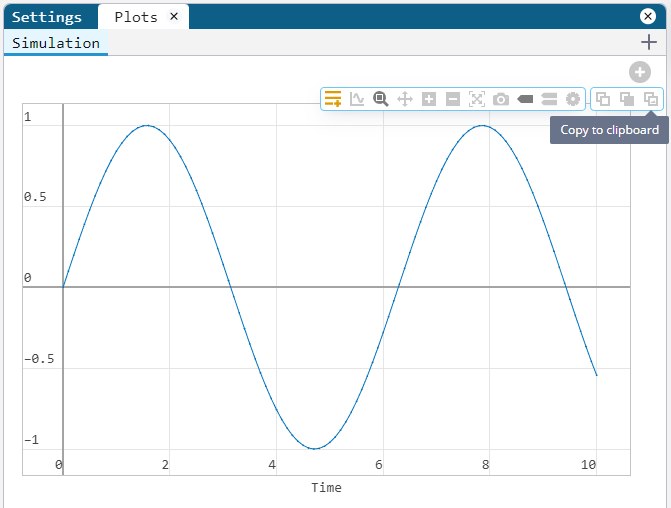
Graphs from models can now be copied to the buffer as an image
Added the ability to quickly share a graph of simulation results without downloading the image to disk. You can click Copy to clipboard and then immediately paste (Ctrl+V) the graph, for example, into Telegram or a text editor.
Possibility to edit other models while executing one model
Now running "heavy" or "long" models does not block the user from creating new models. While the environment is running, you can analyse, edit other models or create new ones.
New blocks and updates
Base library
-
Counter Free-Running - autonomous counter;
-
Pulse Generator - pulse generator;
-
PWM - PWM;
-
Multiport Switch - multichannel switch.
Sensors
-
Flow Rate Sensor (IL) - flow sensor;
-
Liquid Properties Sensor (IL) - fluid properties sensor;
-
Pressure Difference Sensor (IL) - differential pressure sensor;
-
Absolute Pressure Sensor (IL) - absolute pressure sensor;
-
Gauge Difference Sensor (IL) - gauge pressure sensor.
Sources
-
Mass Flow Rate Source (IL) - mass flow rate source;
-
Volumetric Flow Rate Source (IL) - volumetric flow rate source;
-
Pressure Source (IL) - pressure source.
Elements
-
Constant Volume Chamber (IL) - constant volume reservoir;
-
Flow Resistance (IL) - hydraulic resistance;
-
Infinite Flow Resistance (IL) - infinite hydraulic resistance;
-
Laminar Leakage (IL) - laminar leakage;
-
Local Restriction (IL) - local resistance;
-
Pipe (IL) - pipe;
-
Controlled Reservoir (IL) - reservoir;
-
Rotational Mechanical Converter (IL) - rotary motion converter;
-
Translational Mechanical Converter (IL) - translational converter.
Code generation
-
Support for C code generation for block Discrete-Time Integrator.
-
Improvements and fixes in C code generation for multi-frequency models.
Bug fixes
-
Fixed tilde display in latex formula.
-
Fixed creation of a new file, now it is created in the folder clicked by the user.
-
Fixed updating of code cells numbering when one of them is deleted.
-
Fixed automatic adjustment of window size to the screen size.
-
Connectors are arranged on a grid. No more micro-fractures of lines after reloading the model, as the connectors fit logically and clearly to the blocks.