errorbars
|
该页面正在翻译中。 |
#
<无翻译>*麦琪errorbars*-Function
errorbars(x, y, error_both; kwargs...)
errorbars(x, y, error_low, error_high; kwargs...)
errorbars(x, y, error_low_high; kwargs...)

errorbars(xy, error_both; kwargs...)
errorbars(xy, error_low, error_high; kwargs...)
errorbars(xy, error_low_high; kwargs...)

errorbars(xy_error_both; kwargs...)
errorbars(xy_error_low_high; kwargs...)
在xy位置绘制误差,通过给定的误差扩展 方向感.
如果要绘制从低值到高值的间隔而不是相对误差,请使用 rangebars.
绘图类型
绘图类型别名 errorbars 功能是 Errorbars.
例子:
using CairoMakie
f = Figure()
Axis(f[1, 1])

xs = 0:0.5:10
ys = 0.5 .* sin.(xs)

lowerrors = fill(0.1, length(xs))
higherrors = LinRange(0.1, 0.4, length(xs))

errorbars!(xs, ys, higherrors; color = :red, label="data") # same low and high error

# plot position scatters so low and high errors can be discriminated
scatter!(xs, ys; markersize = 3, color = :black, label="data")

# the `label=` must be the same for merge to work
# without merge, two separate legend items will appear
axislegend(merge=true)

f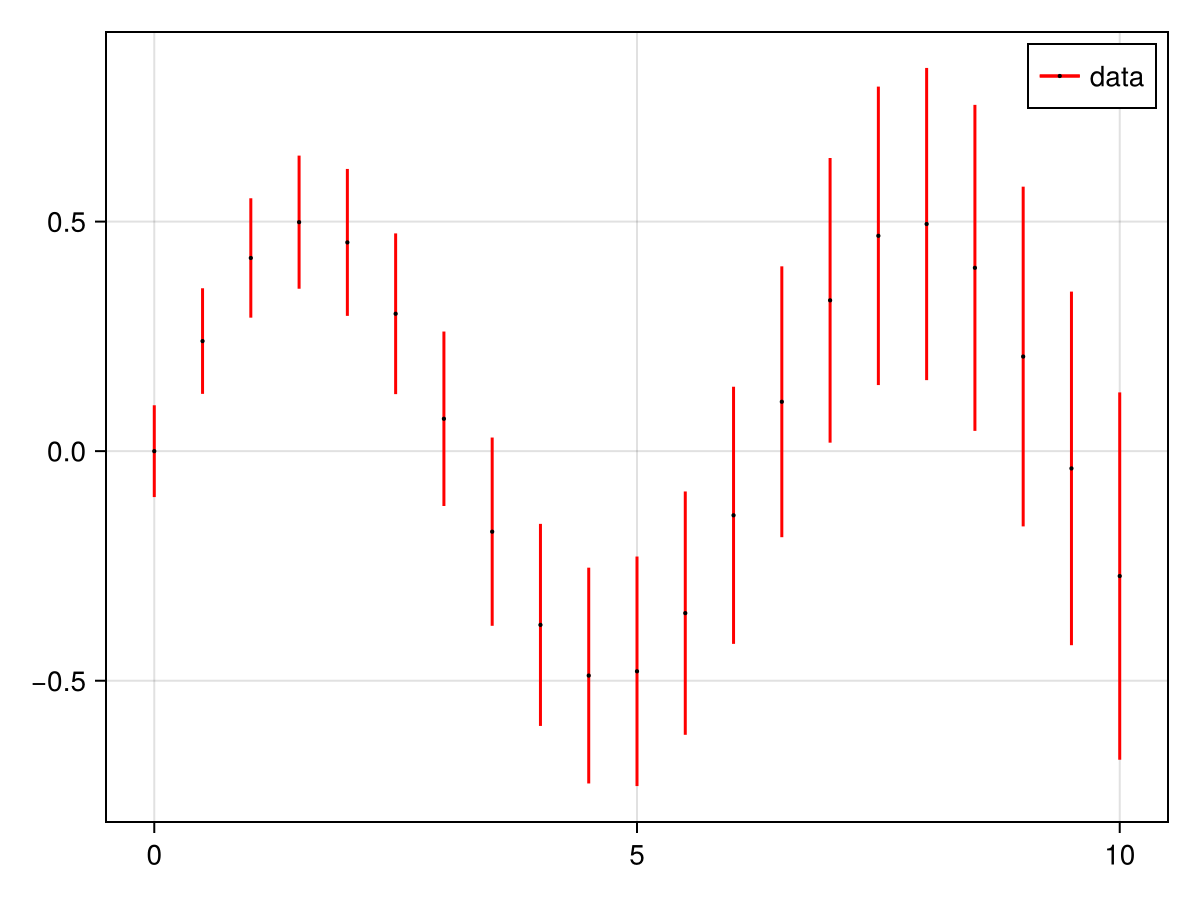
using CairoMakie
f = Figure()
Axis(f[1, 1])

xs = 0:0.5:10
ys = 0.5 .* sin.(xs)

lowerrors = fill(0.1, length(xs))
higherrors = LinRange(0.1, 0.4, length(xs))

errorbars!(xs, ys, lowerrors, higherrors,
    color = range(0, 1, length = length(xs)),
    whiskerwidth = 10)

# plot position scatters so low and high errors can be discriminated
scatter!(xs, ys, markersize = 3, color = :black)

f
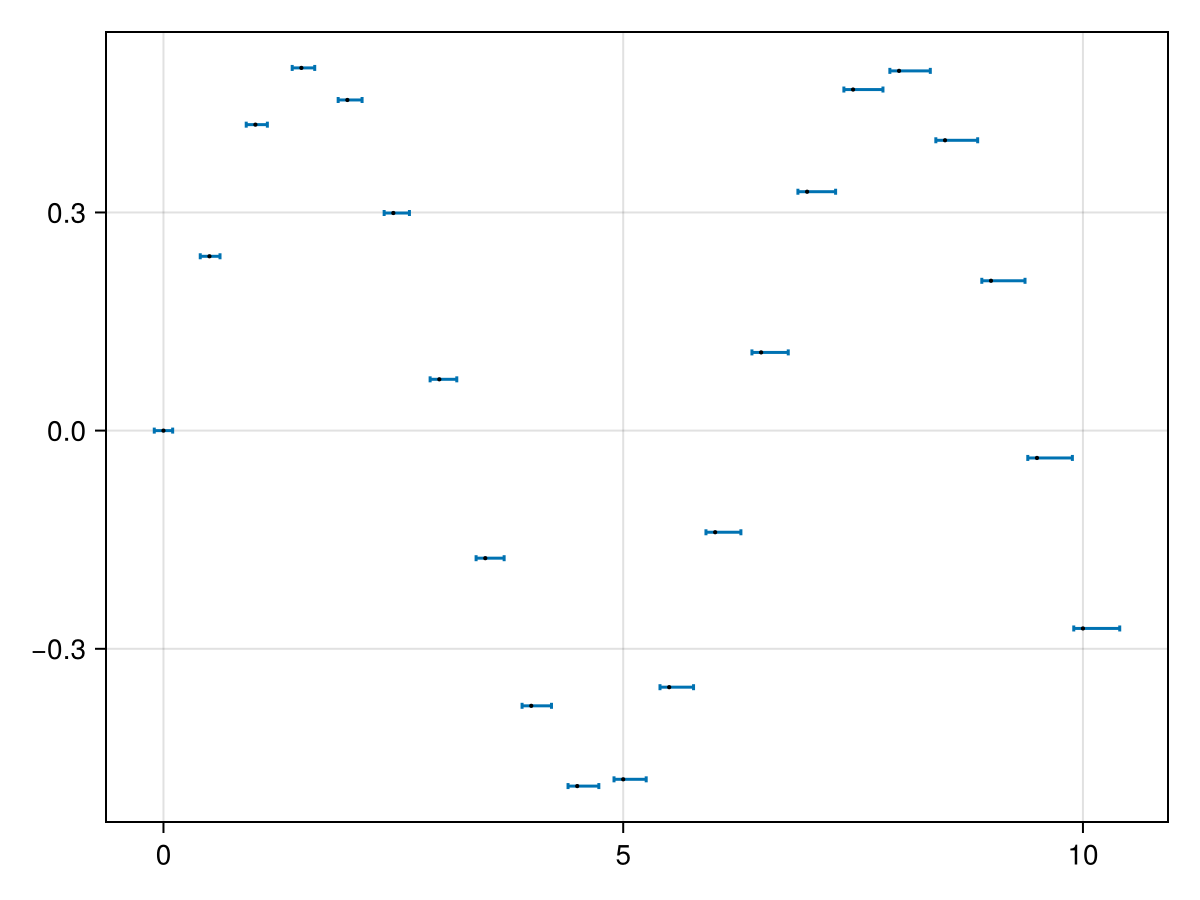
using CairoMakie
f = Figure()
Axis(f[1, 1])

xs=0:0.5:10
ys=0.5。*罪。(xs)

低误差=填充(0.1,长度(x))
higherrors=LinRange(0.1,0.4,长度(x))

errorbars!(xs,ys,lowerrors,higherrors,whiskerwidth=3,direction=:x)

#plot position scatters如此低和高误差可以区分
散开!(xs,ys,markersize=3,颜色=:黑色)

f