雨滴
|
该页面正在翻译中。 |
#
<无翻译>*麦琪雨滴*-Function
rainclouds!(ax, category_labels, data_array; plot_boxplots=true, plot_clouds=true, kwargs...)绘制小提琴(/直方图),箱线图和单个数据点,每个数据点之间有适当的间距。
论点
-
斧头,斧头:轴用来放置所有这些图。 -
分类_标签:典型向量{String}每个元素都有一个标签数据阵列 -
数据阵列:典型向量{Float64}用于表示要绘制的数据点。
关键字
绘图类型
绘图类型别名 雨滴 功能是 雨滴.
using CairoMakie
using Random
using Makie: rand_localized

####
#### Below is used for testing the plotting functionality.
####

function mockup_distribution(N)
    all_possible_labels = ["Single Mode", "Double Mode", "Random Exp", "Uniform"]
    category_type = rand(all_possible_labels)

    if category_type == "Single Mode"
        random_mean = rand_localized(0, 8)
        random_spread_coef = rand_localized(0.3, 1)
        data_points = random_spread_coef*randn(N) .+ random_mean

    elseif category_type == "Double Mode"
        random_mean = rand_localized(0, 8)
        random_spread_coef = rand_localized(0.3, 1)
        data_points = random_spread_coef*randn(Int(round(N/2.0))) .+ random_mean

        random_mean = rand_localized(0, 8)
        random_spread_coef = rand_localized(0.3, 1)
        data_points = vcat(data_points, random_spread_coef*randn(Int(round(N/2.0))) .+ random_mean)

    elseif category_type == "Random Exp"
        data_points = randexp(N)

    elseif category_type == "Uniform"
        min = rand_localized(0, 4)
        max = min + rand_localized(0.5, 4)
        data_points = [rand_localized(min, max) for _ in 1:N]

    else
        error("Unidentified category.")
    end

    return data_points
end

function mockup_categories_and_data_array(num_categories; N = 500)
    category_labels = String[]
    data_array = Float64[]

    for category_label in string.(('A':'Z')[1:min(num_categories, end)])
        data_points = mockup_distribution(N)

        append!(category_labels, fill(category_label, N))
        append!(data_array, data_points)
    end
    return category_labels, data_array
end

category_labels, data_array = mockup_categories_and_data_array(3)

colors = Makie.wong_colors()
rainclouds(category_labels, data_array;
    axis = (; xlabel = "Categories of Distributions", ylabel = "Samples", title = "My Title"),
    plot_boxplots = false, cloud_width=0.5, clouds=hist, hist_bins=50,
    color = colors[indexin(category_labels, unique(category_labels))])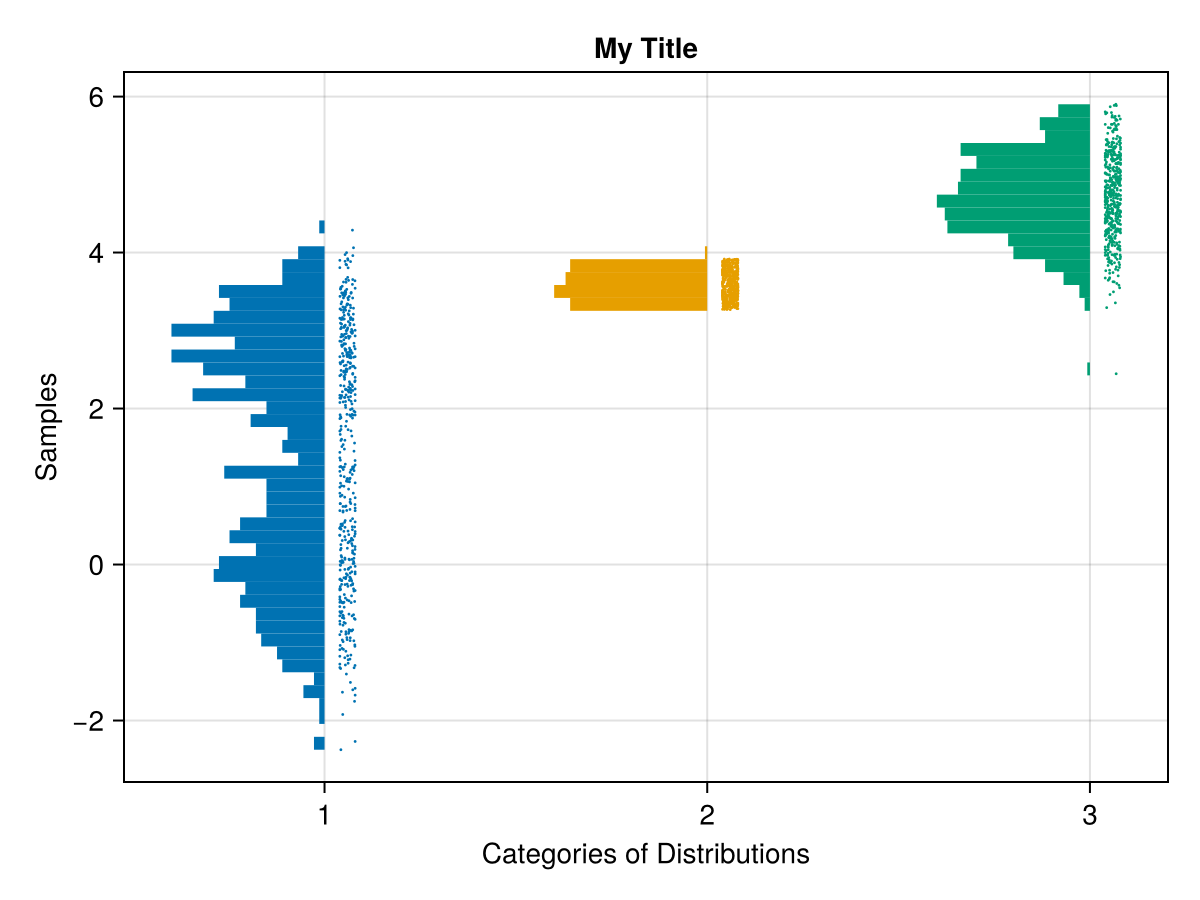
rainclouds(category_labels, data_array;
    axis = (; ylabel = "Categories of Distributions",
    xlabel = "Samples", title = "My Title"),
    orientation = :horizontal,
    plot_boxplots = true, cloud_width=0.5, clouds=hist,
    color = colors[indexin(category_labels, unique(category_labels))])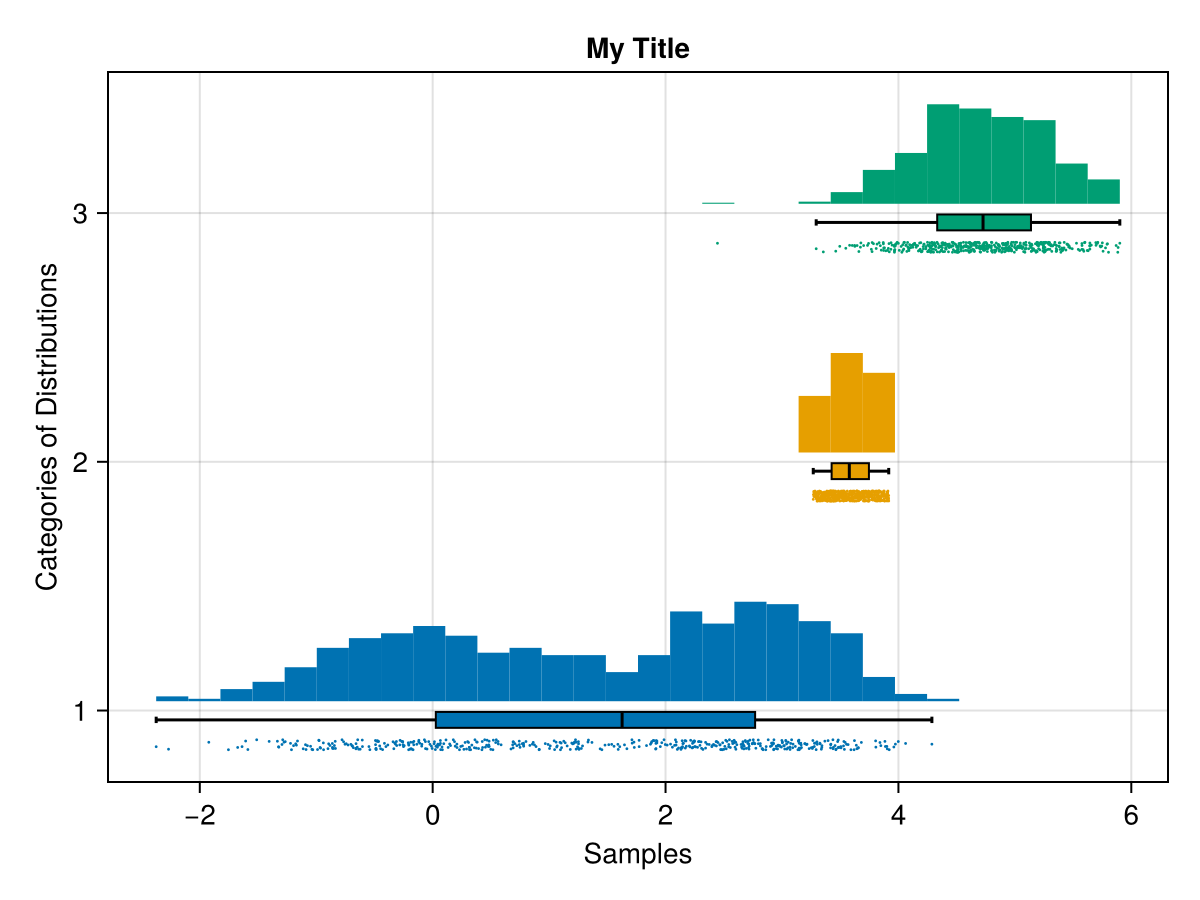
rainclouds(category_labels, data_array;
    axis = (;
        xlabel = "Categories of Distributions",
        ylabel = "Samples",
        title = "My Title"
    ),
    plot_boxplots = true, cloud_width=0.5, clouds=hist,
    color = colors[indexin(category_labels, unique(category_labels))])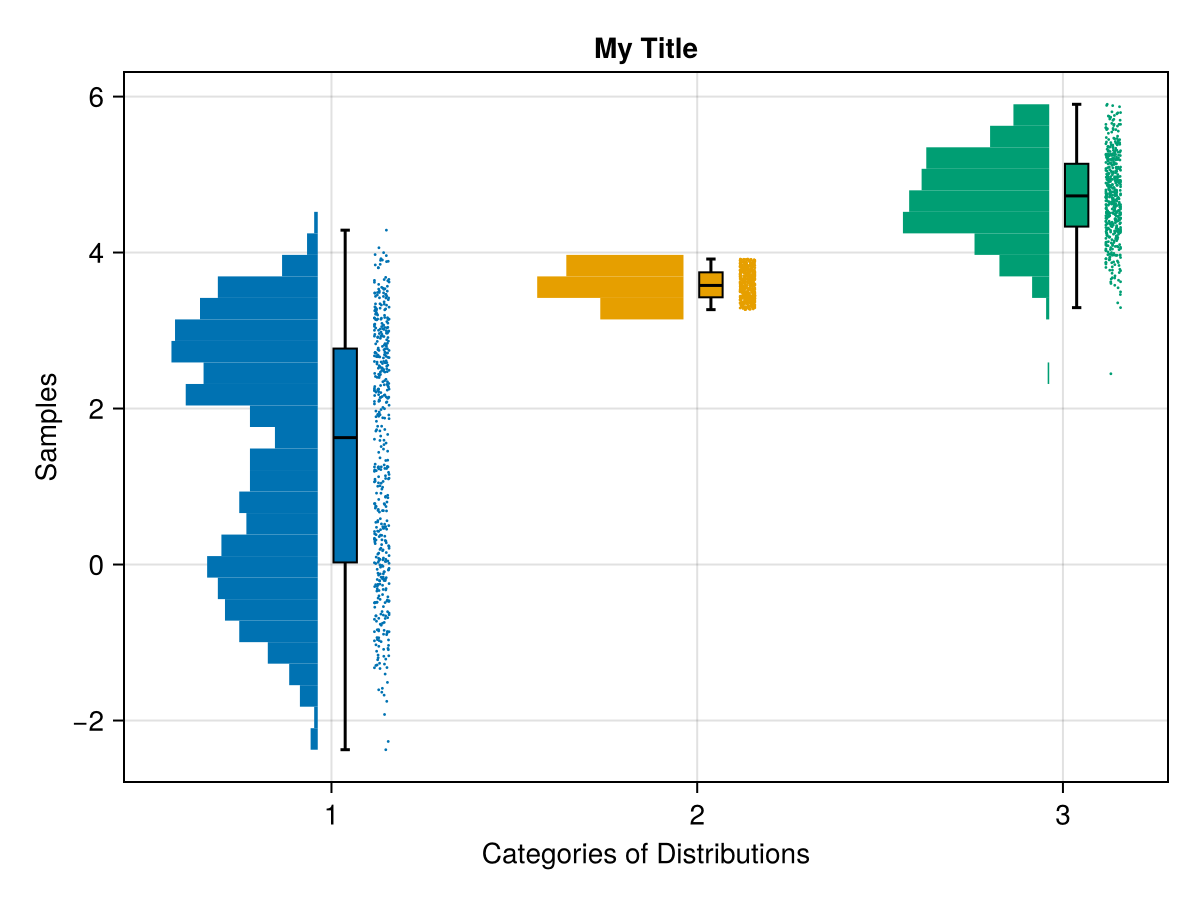
rainclouds(category_labels, data_array;
    axis = (;
        xlabel = "Categories of Distributions",
        ylabel = "Samples",
        title = "My Title"
    ),
    plot_boxplots = true, cloud_width=0.5, side = :right,
    violin_limits = extrema, color = colors[indexin(category_labels, unique(category_labels))])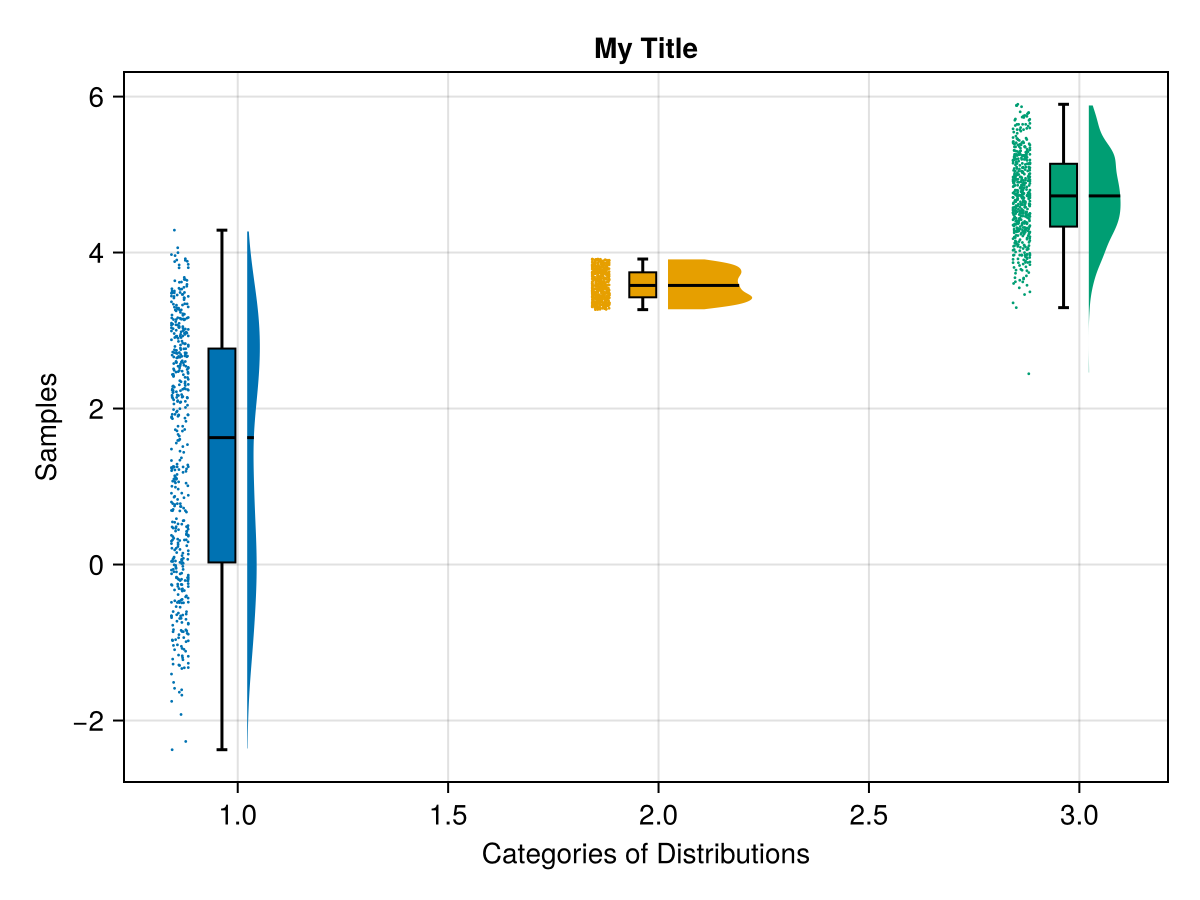
rainclouds(category_labels, data_array;
    axis = (;
        xlabel = "Categories of Distributions",
        ylabel = "Samples",
        title = "My Title",
    ),
    plot_boxplots = true, cloud_width=0.5, side = :right,
    color = colors[indexin(category_labels, unique(category_labels))])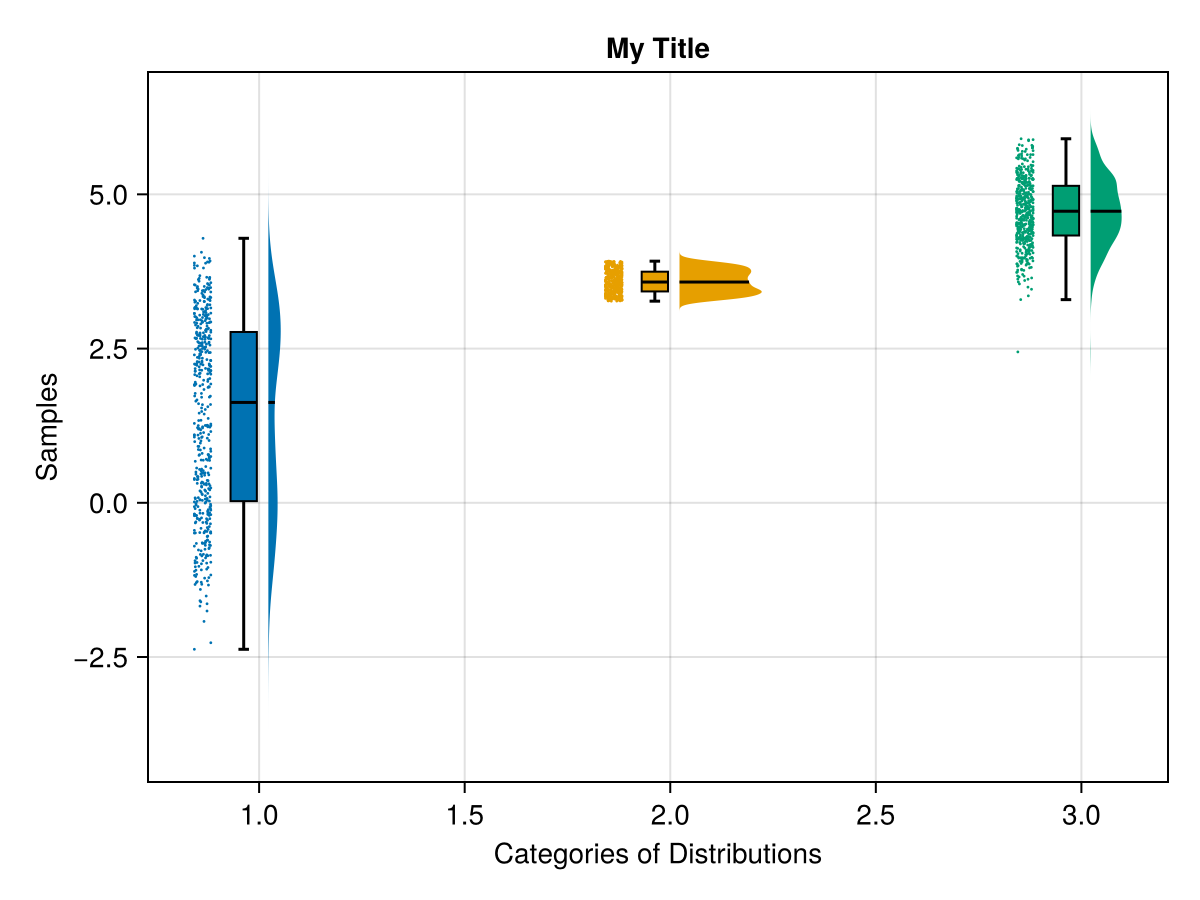
more_category_labels, more_data_array = mockup_categories_and_data_array(6)

rainclouds(more_category_labels, more_data_array;
    axis = (;
        xlabel = "Categories of Distributions",
        ylabel = "Samples",
        title = "My Title",
    ),
    plot_boxplots = true, cloud_width=0.5,
    color = colors[indexin(more_category_labels, unique(more_category_labels))])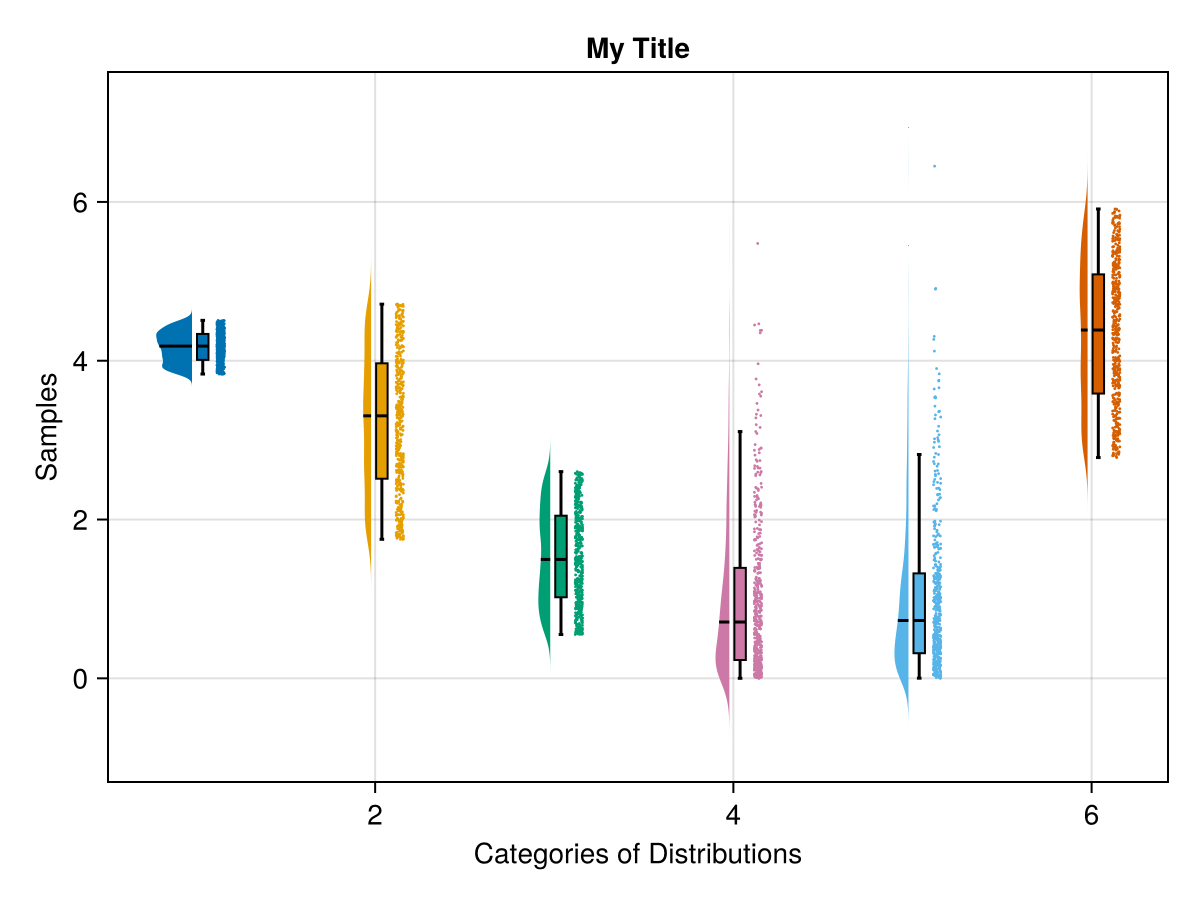
category_labels, data_array = mockup_categories_and_data_array(6)
rainclouds(category_labels, data_array;
    axis = (;
        xlabel = "Categories of Distributions",
        ylabel = "Samples",
        title = "My Title",
    ),
    plot_boxplots = true, cloud_width=0.5,
    color = colors[indexin(category_labels, unique(category_labels))])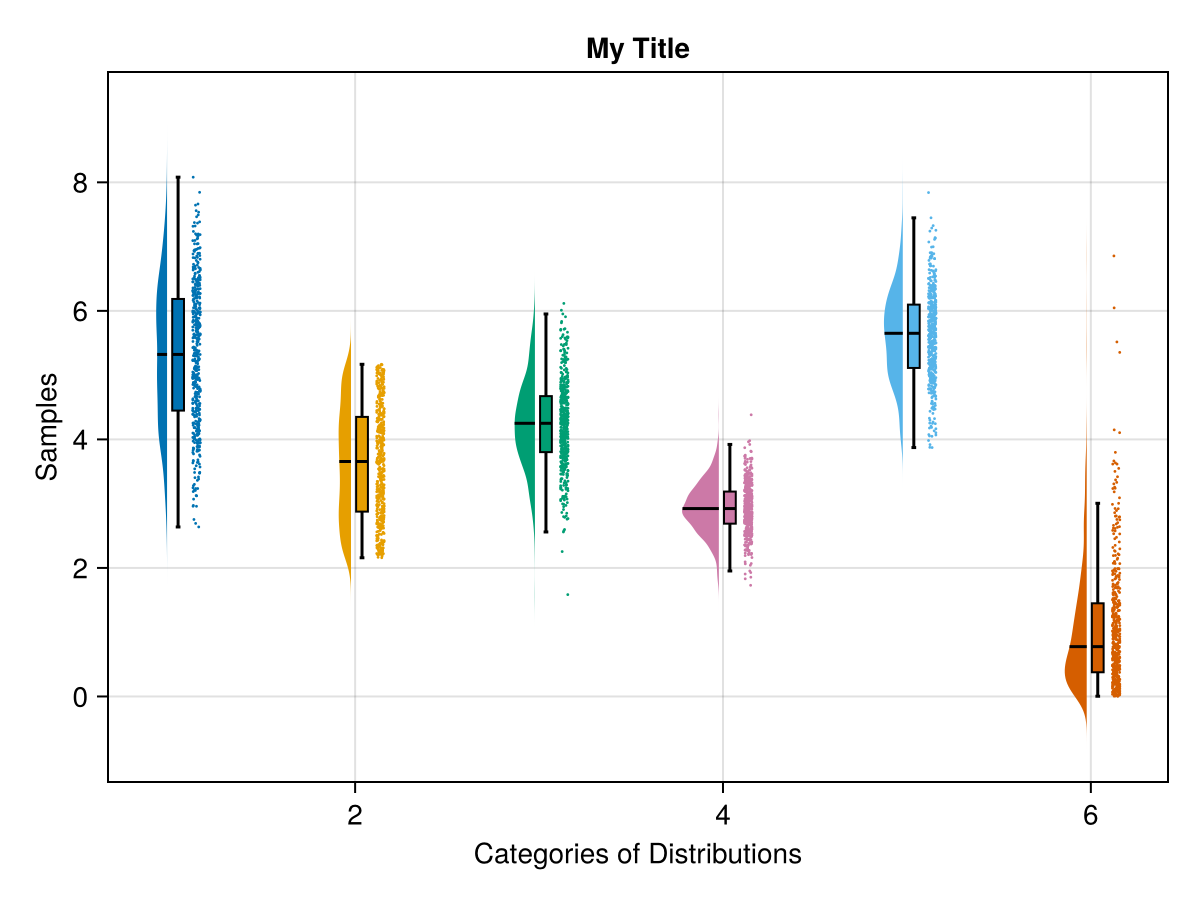
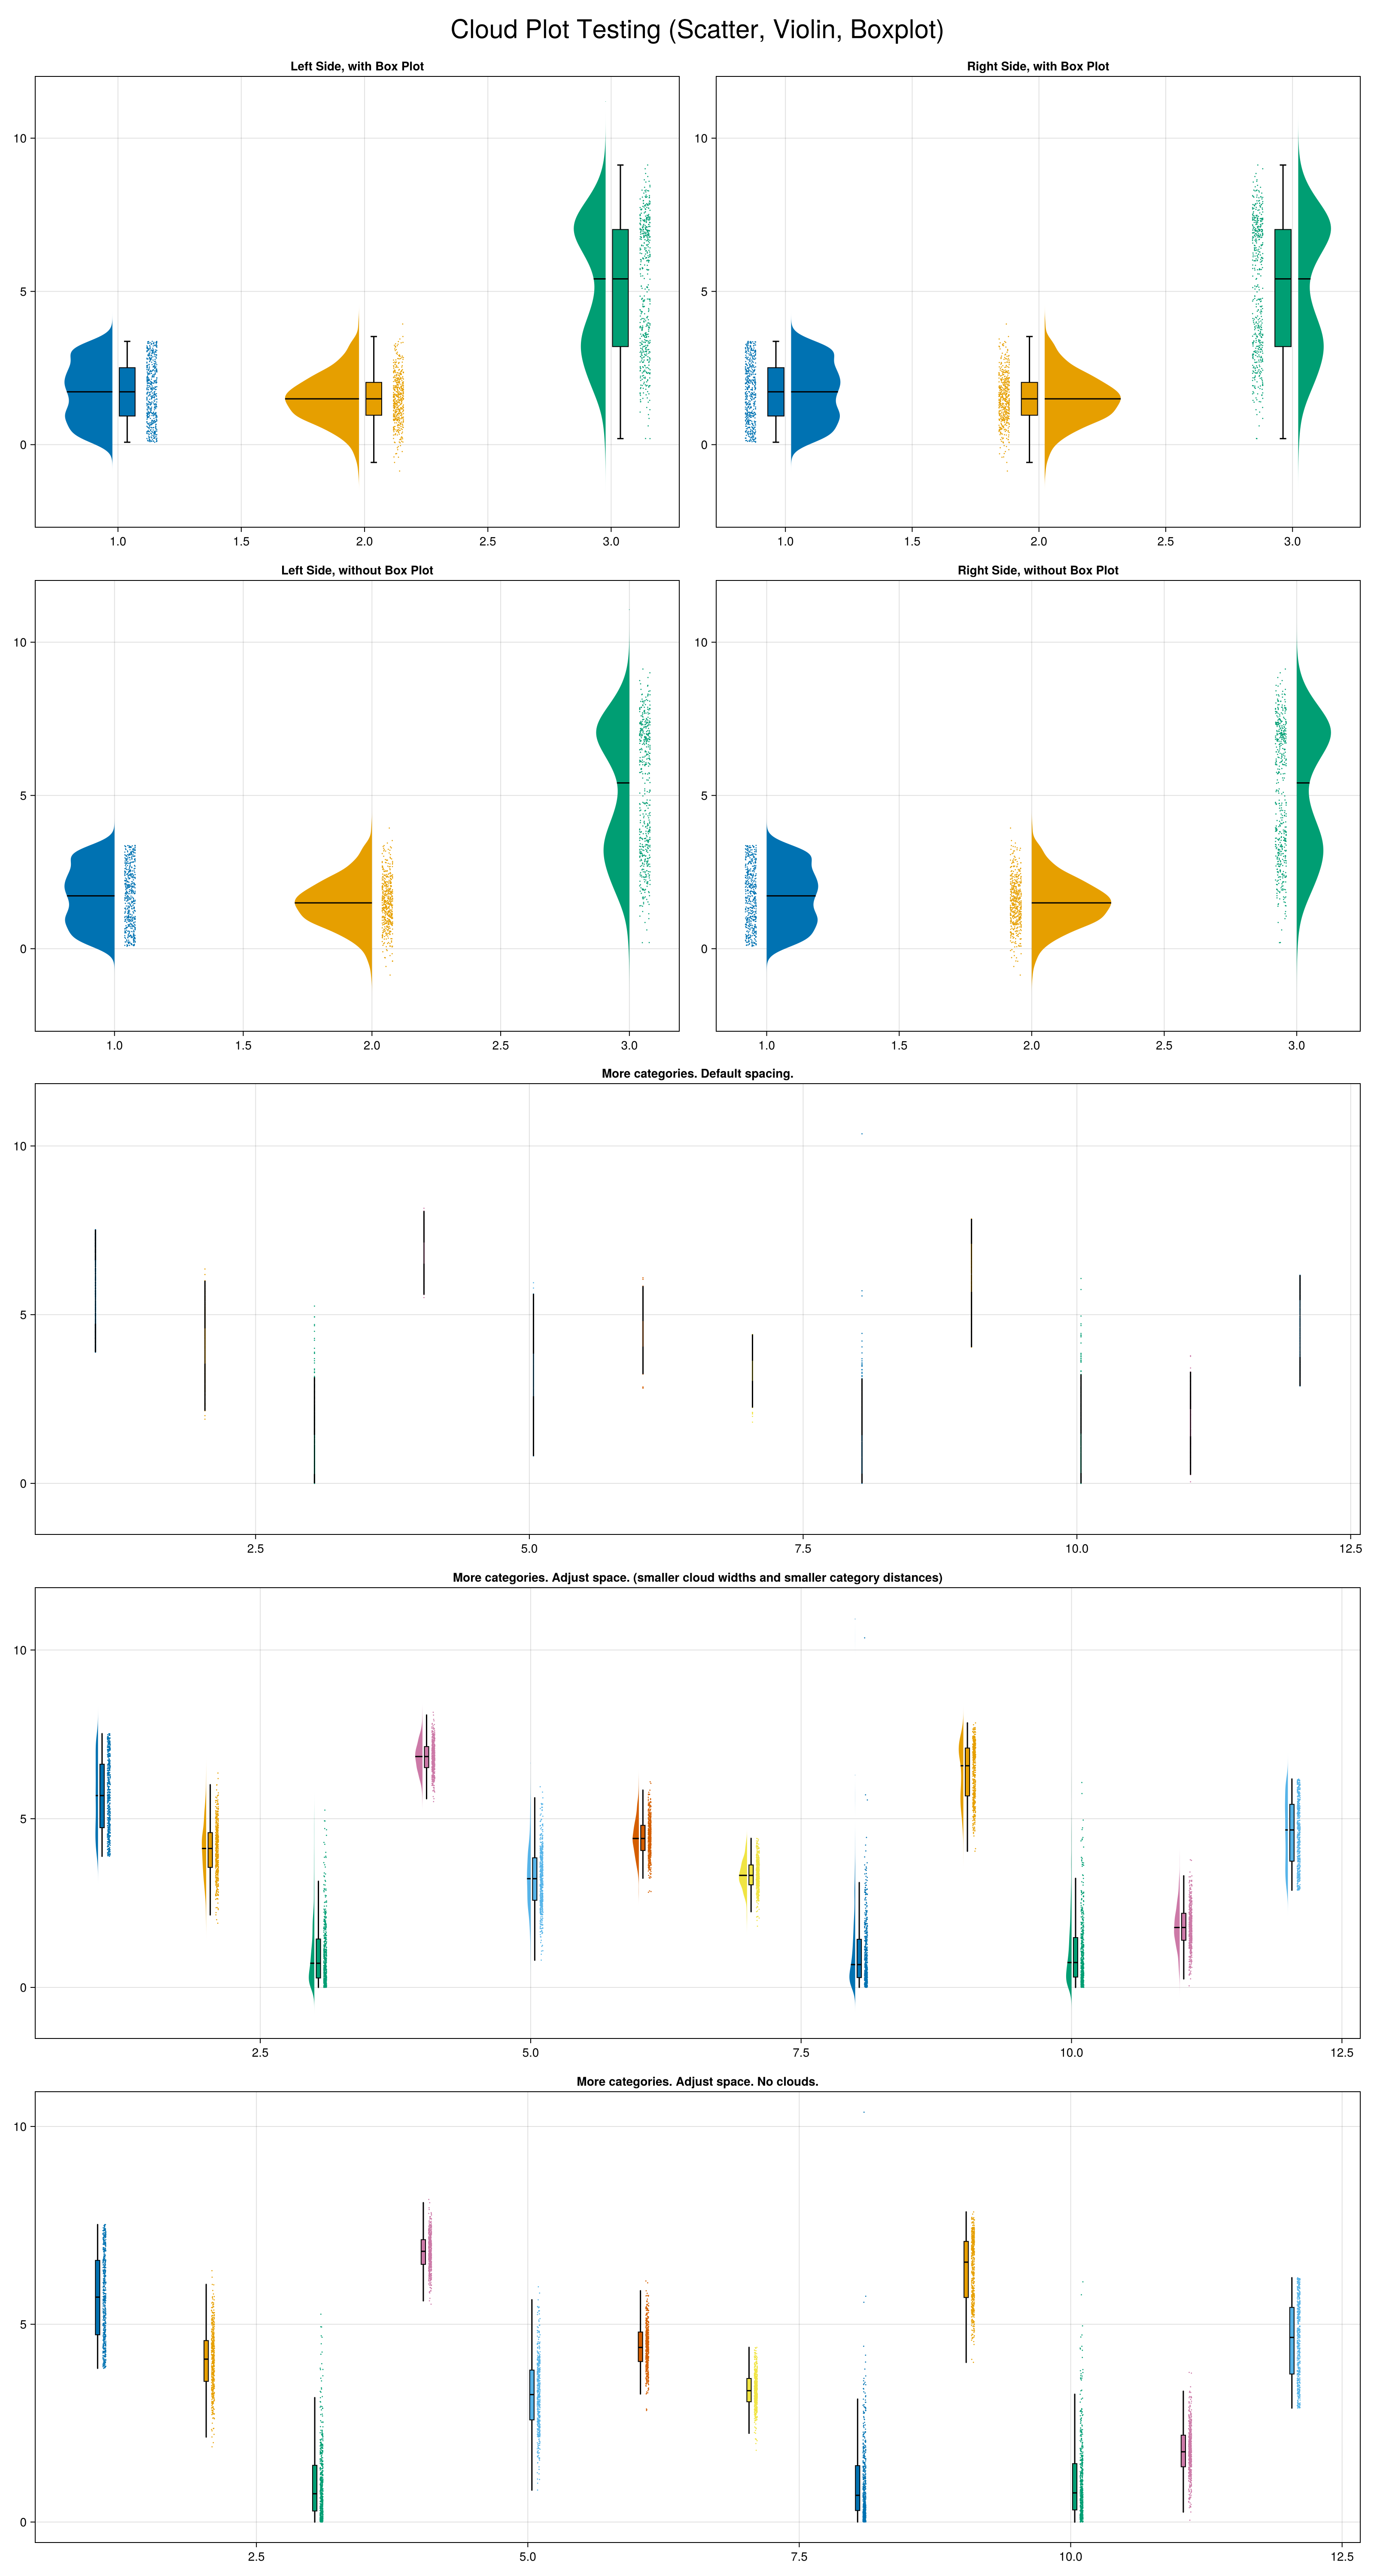
fig = Figure(size = (800*2, 600*5))
colors = [Makie.wong_colors(); Makie.wong_colors()]

category_labels, data_array = mockup_categories_and_data_array(3)
rainclouds!(
    Axis(fig[1, 1], title = "Left Side, with Box Plot"),
    category_labels, data_array;
    side = :left,
    plot_boxplots = true,
    color = colors[indexin(category_labels, unique(category_labels))])

rainclouds!(
    Axis(fig[2, 1], title = "Left Side, without Box Plot"),
    category_labels, data_array;
    side = :left,
    plot_boxplots = false,
    color = colors[indexin(category_labels, unique(category_labels))])

rainclouds!(
    Axis(fig[1, 2], title = "Right Side, with Box Plot"),
    category_labels, data_array;
    side = :right,
    plot_boxplots = true,
    color = colors[indexin(category_labels, unique(category_labels))])

rainclouds!(
    Axis(fig[2, 2], title = "Right Side, without Box Plot"),
    category_labels, data_array;
    side = :right,
    plot_boxplots = false,
    color = colors[indexin(category_labels, unique(category_labels))])

# Plots with more categories
# dist_between_categories (0.6, 1.0)
# with and without clouds

category_labels, data_array = mockup_categories_and_data_array(12)
rainclouds!(
    Axis(fig[3, 1:2], title = "More categories. Default spacing."),
    category_labels, data_array;
    plot_boxplots = true,
    gap = 1.0,
    color = colors[indexin(category_labels, unique(category_labels))])

rainclouds!(
    Axis(fig[4, 1:2], title = "More categories. Adjust space. (smaller cloud widths and smaller category distances)"),
    category_labels, data_array;
    plot_boxplots = true,
    cloud_width = 0.3,
    gap = 0.5,
    color = colors[indexin(category_labels, unique(category_labels))])

rainclouds!(
    Axis(fig[5, 1:2], title = "More categories. Adjust space. No clouds."),
    category_labels, data_array;
    plot_boxplots = true,
    clouds = nothing,
    gap = 0.5,
    color = colors[indexin(category_labels, unique(category_labels))])

supertitle = Label(fig[0, :], "Cloud Plot Testing (Scatter, Violin, Boxplot)", fontsize=30)
fig