Signal constellations
Constellation diagram A constellation diagram is a graphical method of representing modulated signals in digital communications. It is used to visualize the symbols transmitted in a modulated signal, and helps analyze the quality of data transmission and detect distortions.
In the constellation diagram, each point (or symbol) represents a complex value of the modulated signal, where the axis indicates the real part of the signal, and the axis — the imaginary part. The points are located in the nodes of the grid, which correspond to different combinations of phases and amplitudes of the signal.
To build a signal constellation in Engee in the signal visualization window  move the mouse cursor to display tool windows, in Signal Menu
  and change the graph display to Constellation diagram
  :
:
Graph axes:
-
In-phase Amplitude (amplitude in phase) is the projection of the signal onto the axis . It is responsible for the common-mode component of the signal. The common-mode component means that this component is modulated by a sinusoid that is in phase with the carrier frequency.
-
Quadrature Amplitude (quadrature amplitude) — projection of the signal onto the axis . Responsible for the quadrature component of the signal. The quadrature component means that this component is modulated by a sinusoid shifted in phase by 90 degrees relative to the carrier frequency.
The main features of the signal constellation:
-
The positions of the points on the diagram are determined by the selected modulation scheme (for example, QPSK, 16-QAM). Each point corresponds to a certain combination of bits.
-
Deviations of the points from their ideal positions may indicate the presence of noise or distortion in the transmission channel. The closer the points are to their ideal positions, the higher the signal quality.
-
The constellation diagram allows you to quickly and visually assess the effect of noise and distortion on the modulated signal.
Constellation diagrams are useful for visualizing the effect of various types of distortion and noise on the transmitted signal.:
-
Gaussian noise — When white Gaussian noise is added to the signal, the points on the constellation diagram begin to "blur" around their ideal positions. This blurring indicates a decrease in the signal-to-noise ratio (SNR).
-
Phase noise — causes fluctuations of points along the circles around their ideal positions, which indicates instability of the signal phase.
-
Interference — mutual interference (interference) can shift points in different directions, leading to additional distortions.
-
Intersymbol interference (ISI) — causes the points of the constellation diagram to "spread out", especially if the symbols influence each other.
Example
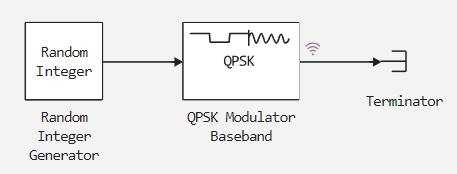
Expand the model from the blocks:
Turn it on signal recording  at the block output QPSK Modulator Baseband. The model will look like this:
For the block Random Integer Generator set the Set size parameter to 4. Leave the rest of the block parameters and model settings as default. In the visualization window click Signal Menu and change the graph display to Constellation diagram . Next, go to Settings:

In the tab Signals install:
-
The number of visualization points is set to
100for better visualization. -
The reference constellation is in `QPSK' because the block is selected as the modulation source QPSK Modulator Baseband.
To achieve the most optimal values, it is recommended that the modulation source and the selected signal constellation modulation match.
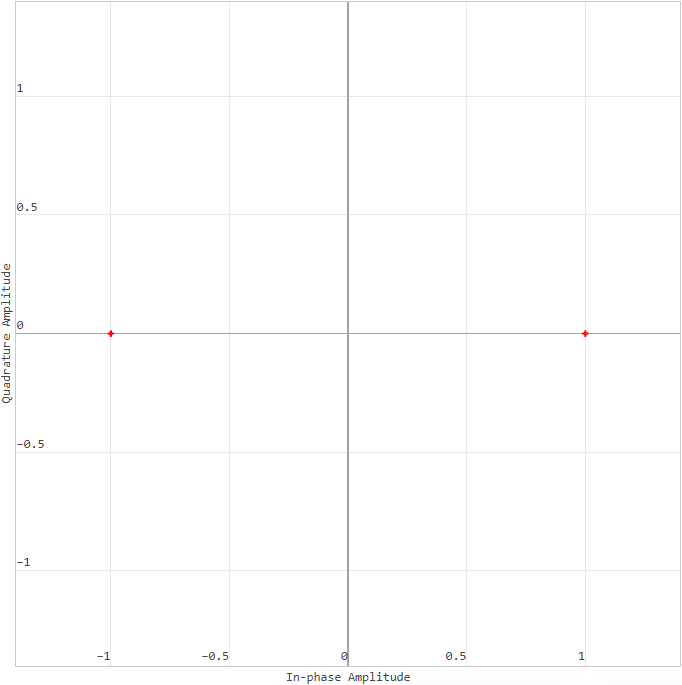
After running the simulation  A schedule will be received.:
During the simulation of the model, no deviations in the modulation were detected, which means that all points fell into the expected area and the graph shows pure modulation without noise.
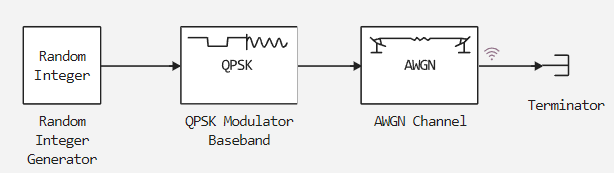
For clarity, add a Gaussian noise source block to the model. AWGN Channel and turn on the recording for its output signal:
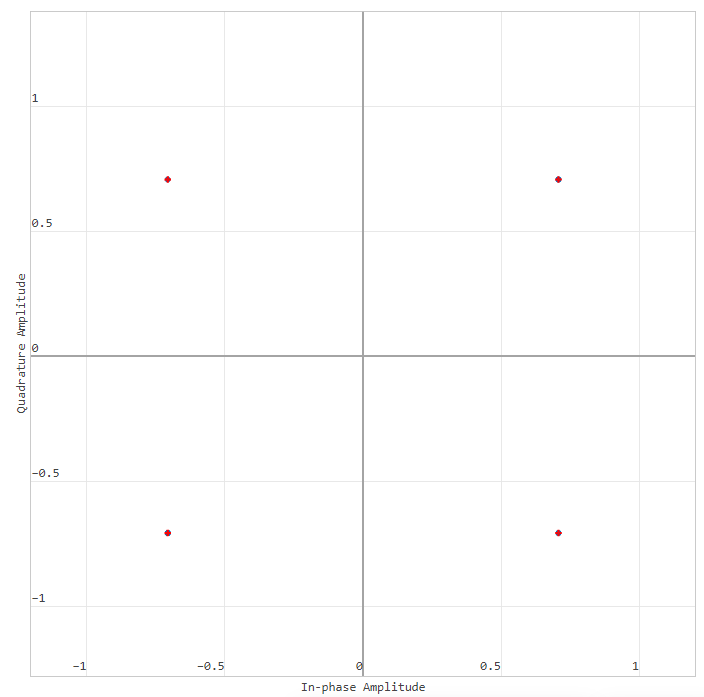
The block parameters and model settings remain by default. In the graph window, select a new signal and, as shown earlier, set the same values for the number of points and the reference constellation. The result will be a graph.:
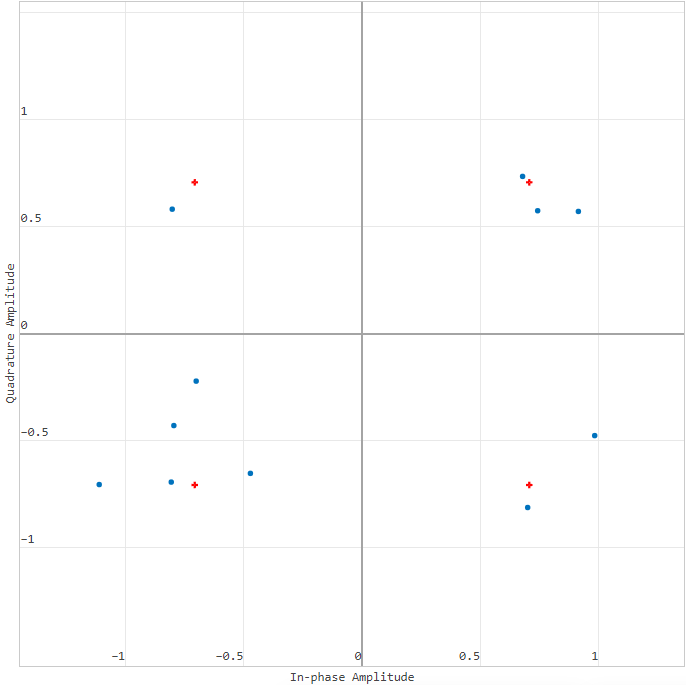
The graph shows that there is noise in the modulation — the symbols have moved away from the reference points.