Graphical comparison of exponential functions
This example discusses a graphical approach to determining the larger of the two values.: and .
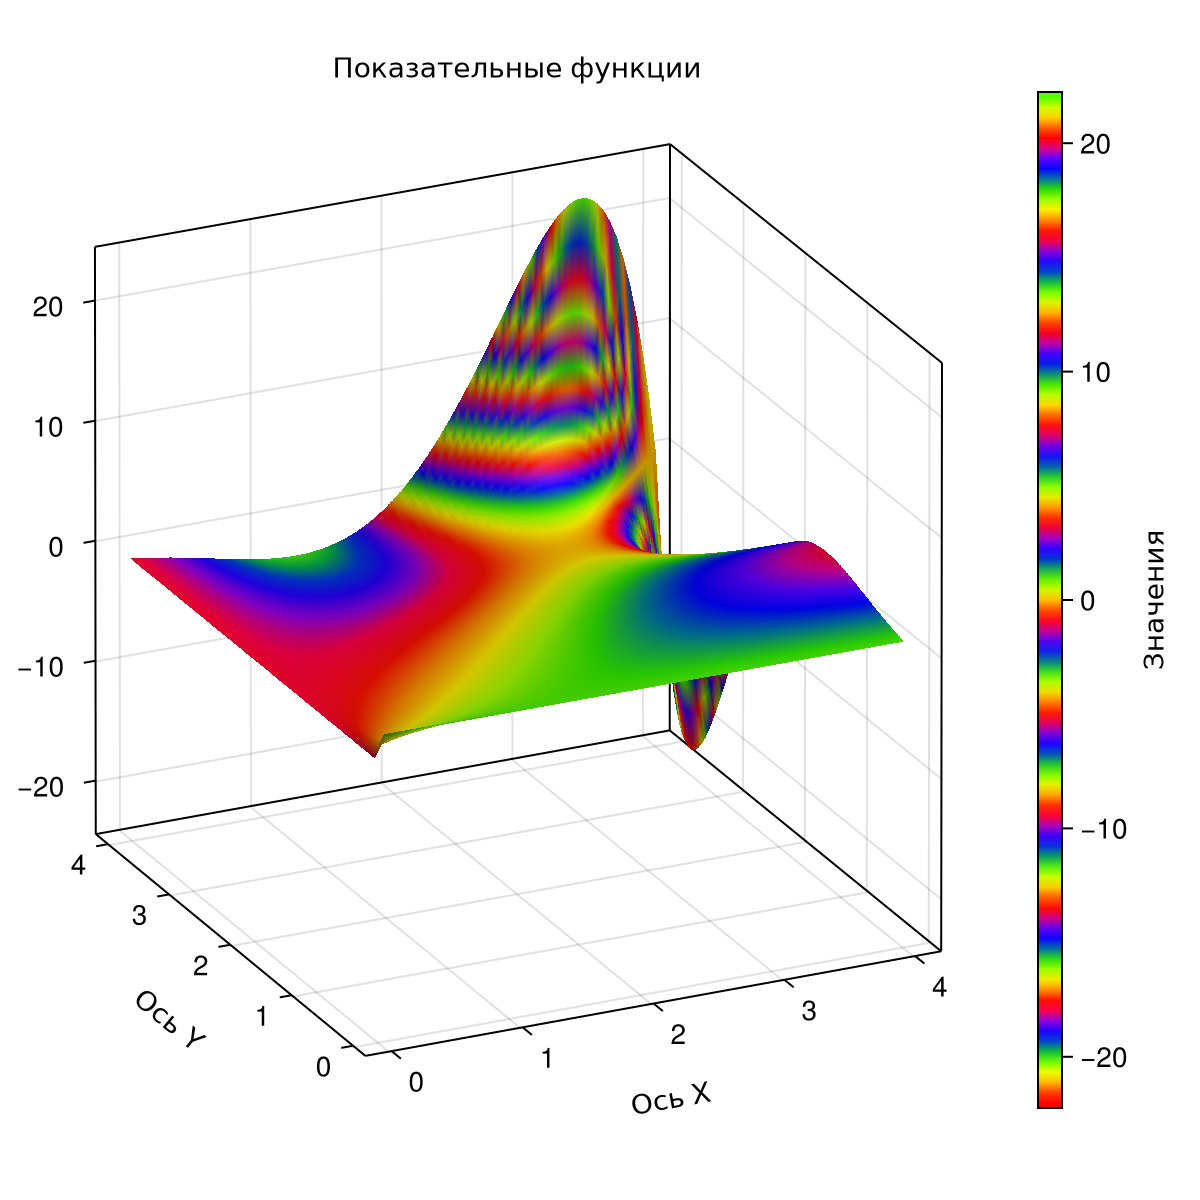
For graphical comparison of values and let's construct the surface of the difference function of exponential functions .
To do this, first of all, install and connect the library. CairoMakie.
import Pkg; Pkg.add("CairoMakie");
using CairoMakie;
Define arrays of surface coordinates.
x = 0:0.05:4; y = 0:0.05:4;
X = [i for i in x, j in 1:length(y)]; Y = [j for i in 1:length(x), j in y];
Z = X.^Y-Y.^X;
Let's construct a surface using a given function.
using CairoMakie

# Creating a shape and 3D axes
fig = Figure(;size = (600, 600));
ax = Axis3(fig[1, 1],
          title = "Exponential functions",
          xlabel = "The X-axis", ylabel = "The Y axis", zlabel = "The Z axis",
          aspect=(1,1,1), azimuth=-pi*0.64);

# Creating a surface
CairoMakie.surface!(ax, x, y, Z,
                    colormap = :prism,
                    colorrange = (minimum(Z), maximum(Z)));

# Adding a color scale
Colorbar(fig[1, 2],
         limits = (minimum(Z), maximum(Z)),
         colormap = :prism, label = "Values");

display(fig);
In the plane let's draw a contour on the constructed surface.
CairoMakie.contour3d!(ax, x, y, Z,
                      levels = [0],
                      color=:black, linewidth=2)
display(fig);

There are several points of integer solutions of the equation on the constructed contours. . Let's plot these points on the contours.
# arrays of integer solutions of the equation
ix=[0,1,2,2,3,4,4]
iy=[0,1,2,4,3,2,4]
iz=zeros(7)

CairoMakie.scatter!(ax, ix, iy, iz;
                    color=:black)
display(fig);

Now let's plot the points of the function for the desired and by coordinates: and .
e=exp(1);
tx=[pi,e]
ty=[e,pi]
textt=["pi,e", "e,pi"]
tz=tx.^ty-ty.^tx

CairoMakie.scatter!(ax, tx, ty, tz;
                    color=:white)
CairoMakie.text!(ax, tx, ty, tz;
                 text = textt, align = (:right, :bottom),
                 color = :white)
display(fig);
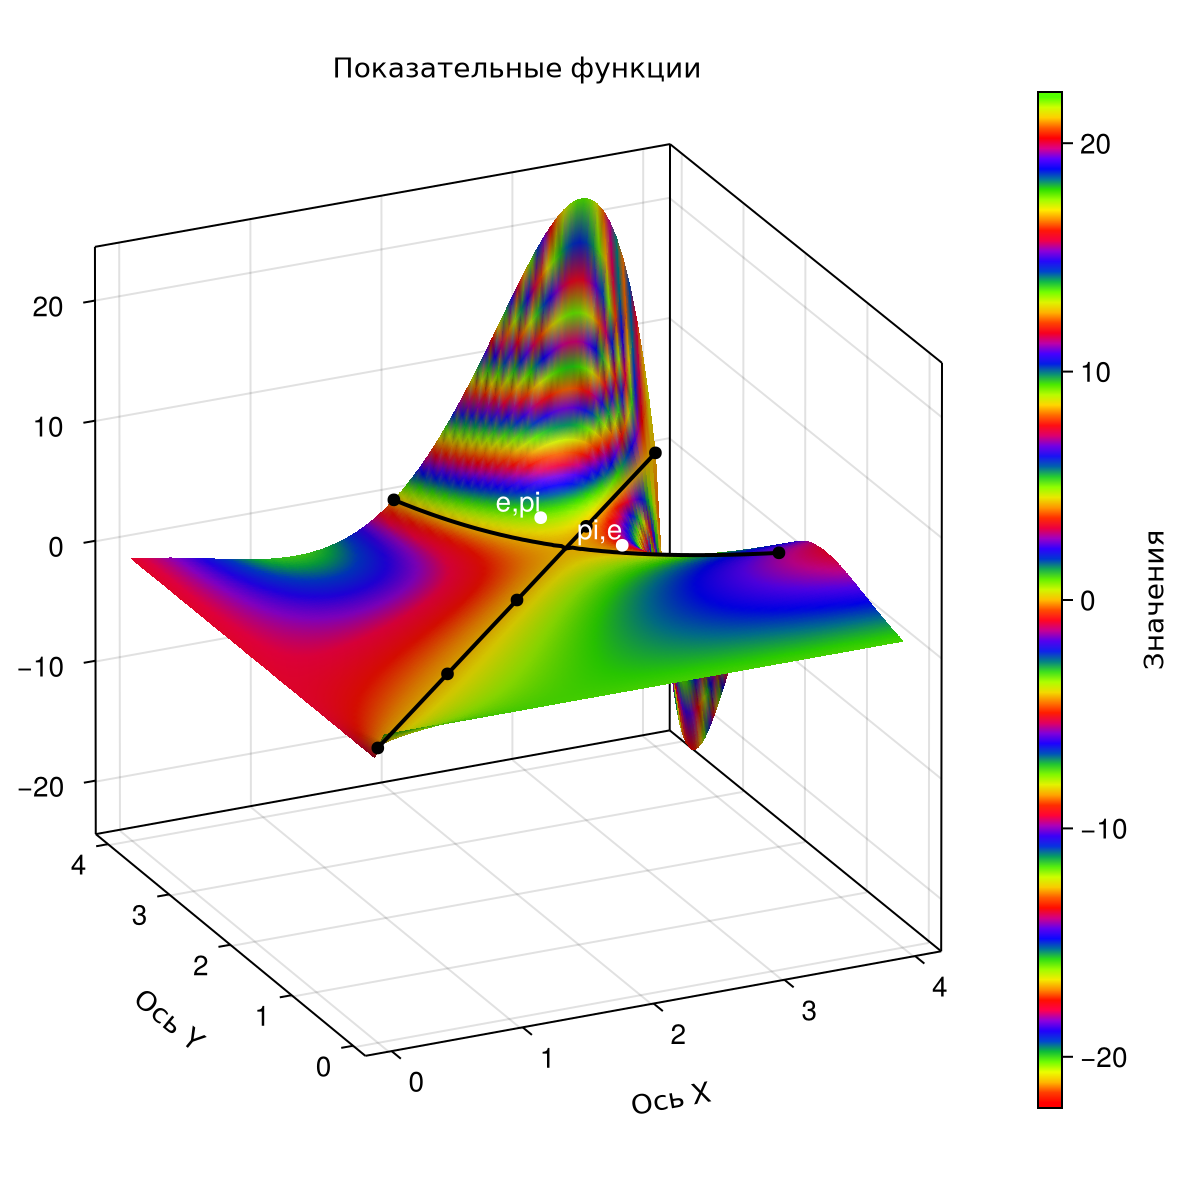
It can be seen from the construction that the point with the coordinates It is located in the part of the surface that is above the plane. , and the dot - in the part of the surface below the secant plane. To make it easier to view the location of the points, you can edit the azimuth of the axes and mask the code cell.:
Азимут=-0.38 # @param {type:"slider",min:-6.28,max:6.28,step:0.1}
ax.azimuth[] = Azimuth;
display(fig);
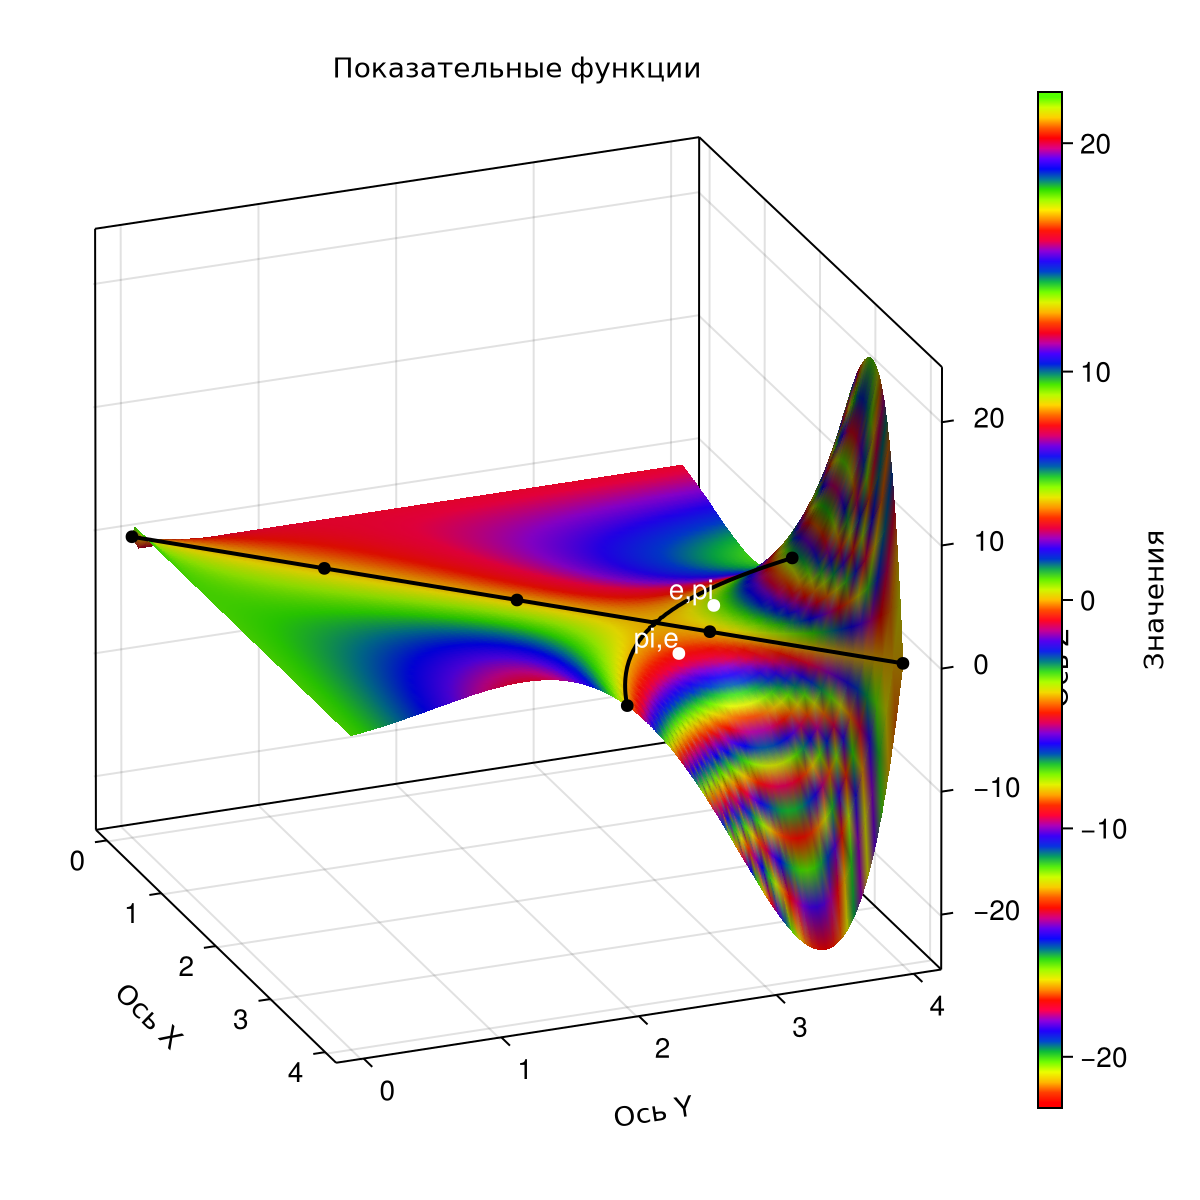
From this we can conclude that the value of more . To confirm, we will calculate these values.
@show e^pi, pi^e;
Conclusion
In this example, we have considered a visual way to graphically find the larger of the two values.