Construction of the Silasi polyhedron (Silahedron)
In this demo example, we consider the construction of a Silashi polyhedron using the function mesh3d() from the library Plots.jl.
Introduction
Силаэдр is a nonconvex toroidal polyhedron for which the following equality holds from the Euler-Poincare characteristic
where - the number of faces of the polyhedron, and - the number of holes in the surface in which it is embedded.
This equality follows from the condition that in such a polyhedron each face has a common edge with any other face.
The sylahedron has 7 hexagonal faces, 14 vertices, and 21 edges. In the example, we will construct this polyhedron in the Cartesian coordinate system based on the available coordinates of the vertices.
Coordinates of the vertices
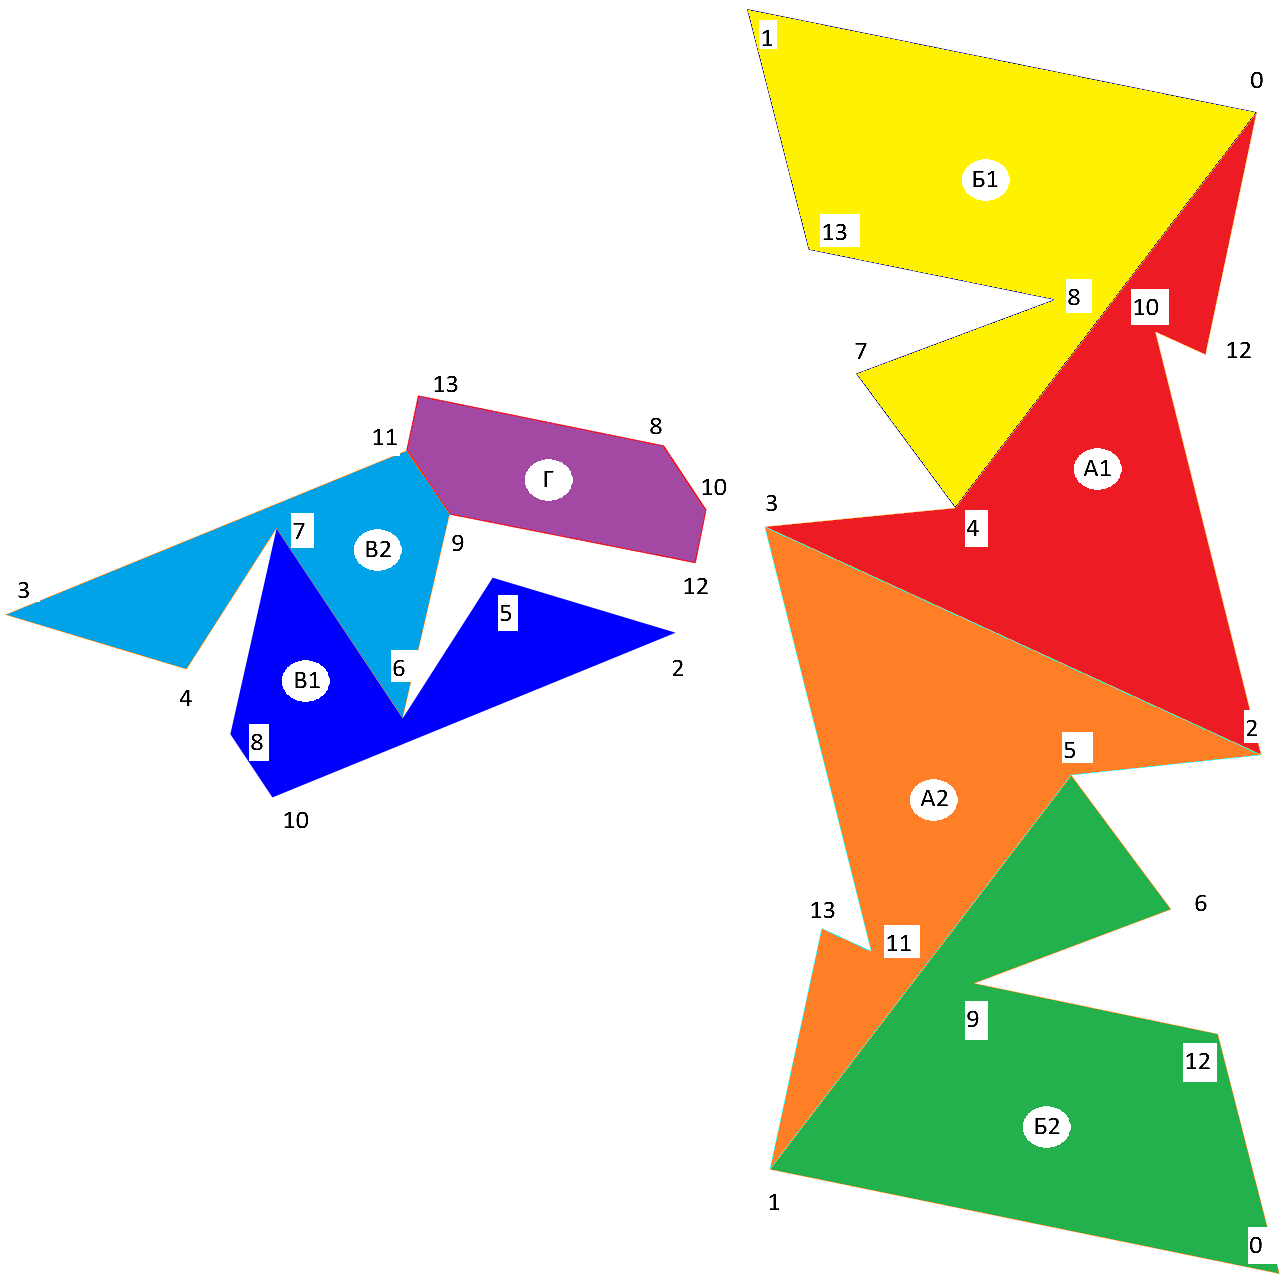
To begin with, we will introduce notation for faces and vertices. Vertices have consecutive numerical designations from 0 to 13, pairwise congruent faces have consecutive alphanumeric designations: A1, A2, B1, B2, B1, B2, and an unpaired face has the letter designation G.
The corresponding symbols are indicated on the polyhedron scan shown below and a color palette is introduced, which will be used later in the construction of the sylahedron.
Let's add variables to the workspace Engee that characterize the Cartesian coordinates of the vertices of the Sylahedron. These coordinates are determined from the conditions that the geometric center of the polyhedron is located at the origin, and the length of its smallest face is one.
# Coordinates of the vertices:
# coordinates of [x, y, z] vertex number
Vertexes = [
            [12,  0, 12],           # 0
            [-12, 0, 12],           # 1
            [0, 12.6, -12],         # 2
            [0, -12.6, -12],        # 3
            [2, -5, -8],            # 4
            [-2, 5, -8],            # 5
            [3.75, 3.75, -3],       # 6
            [-3.75, -3.75, -3],     # 7
            [4.5, -2.5, 2],         # 8
            [-4.5, 2.5, 2],         # 9
            [7, 0, 2],              # 10
            [-7, 0, 2],             # 11
            [7, 2.5, 2],            # 12
            [-7, -2.5, 2]           # 13
          ];

# extracting vectors of vertex coordinates along axes
Vertice_matrix = Base.stack(Vertices, dims = 1);
Vertices X = Vertices matrix[:, 1];
Vertexes Y = Vertexes matrix[:, 2];
Vertice_z = Vertice_matrix[:, 3];
In the vector Вершины The coordinate vectors for the vertices with the ordinal numbers indicated in the comments are given. For the convenience of their construction, the coordinates along the axes are extracted into separate vectors.
Connecting vertices
To build faces using the function Plots.mesh3d() It is necessary to define three vectors (I, J, K), the corresponding indices of which are the vertices of the triangle belonging to the face of the polyhedron. For example, in the face A1 there are 4 disjoint triangles formed by the vertices 0-10-12, 0-4-10, 4-2-10 and 4-3-2.
Thus, we divide each face of the sylahedron into disjoint triangles, and write the vertices forming them into the corresponding indices of the vectors I, J, K. To correctly display the color fill of the faces during construction, the vertices of the triangles should be inserted into the vectors without changing the direction of traversal of the vertices for one face.
# dividing faces into triangles:
# face A1 (consists of triangles 0-10-12, 0-4-10, 4-2-10, 4-3-2)
A1_i = [0, 0, 4, 4];
A1_j = [10, 4, 2, 3];
A1_k = [12, 10, 10, 2];
Connection_A1 = (A1_i, A1_j, A1_k);

# face A2
A2_i = [1, 1, 5, 5];
A2_j = [11, 5, 3, 2];
A2_k = [13, 11, 11, 3];
Connection_A2 = (A2_i, A2_j, A2_k);

# face B1
B1_i = [0, 0, 0, 4];
B1_j = [8, 1, 13, 8];
B1_k = [4, 13, 8, 7];
Junction_b1 = (B1_i, B1_j, B1_k);

# face B2
B2_i = [1, 1, 1, 5];
B2_j = [9, 0, 12, 9];
B2_k = [5, 12, 9, 6];
Junction_b2 = (B2_i, B2_j, B2_k);

# face B1
B1_i = [10, 10, 10, 5];
B1_j = [8, 7, 6, 2];
In1_k = [7, 6, 2, 6];
Connection_in1 = (B1_i, B1_j, B1_k);

# face B2
B2_i = [11, 11, 11, 7];
B2_j = [9, 6, 7, 4];
B2_k = [6, 7, 3, 3];
Connection_in2 = (B2_i, B2_j, B2_k);

# the face of G
G_i = [11, 10, 8, 8];
G_j = [8, 9, 11, 9];
G_k = [13, 12, 9, 10];
JUNCTION_G = (G_i, G_j, G_k);

# vectors of values for constructing faces
Connections = [Junction_a1, Junction_a2, JUNCTION_B1,
              JUNCTION_B2, JUNCTION_B1, JUNCTION_B2, JUNCTION_G];
Rainbow = [:red, :orange, :yellow, :green, :cyan, :blue, :purple];
Подпись = ["A1", "A2",    "B1",    "B2",   "B1",  "B2",  "G"    ];
The resulting vectors are combined into tuples for transmission to the function mesh3d(), the variables of the color palette and the designations of the faces of the polyhedron are defined.
Construction of a sylahedron
Connecting the library Plots.jl and a backend for building:
# connecting the library and backend
using Plots;
plotlyjs();
Let's introduce the function Грань() to plot vertices and faces by index:
# a function for constructing vertices and faces
function Face(number)
    if number == 0
        Plots.scatter3d(Vertices X, Vertices Y, Vertices Z;
                        label="vertexes", color = :black, markersize = 1,
                        xlabel = "x", ylabel = "y", zlabel = "z",
                        camera = (130, 20))
    else
        Plots.mesh3d!(Vertices X, Vertices Y, Vertices Z;
                      connections = Connections[number],
                      color = Rainbow[number], label = Signature[number])
    end
end;
Let's construct the vertices and the resulting faces in a cycle:
# building vertices
Plots.scatter3d(Vertices X, Vertices Y, Vertices Z;
                label="vertexes", color = :black, markersize = 1)

# building faces in a cycle
for N in 1:7
    Face(N)
end

# stage design
plot!(xlabel = "x", ylabel = "y", zlabel = "z", camera = (130, 20))
The connected backend ensures the construction of a polyhedron with high interactivity. The silahedron can be scaled, rotated, and the display of elements (faces and vertices) can be enabled or disabled.
In conclusion, let's create an animation of the sequential construction of the faces of the sylahedron.:
# animation of the sequential construction of faces
animation = @animate for N in [0, 7, 6, 5, 2, 1, 3, 4]
    Face(N)
end;

gif(анимация, "Силаэдр.gif", fps = 1)
Conclusion
In this example, we examined the construction of the Silashi polyhedron by coordinates using the function mesh3d() from the library Plots.jl.