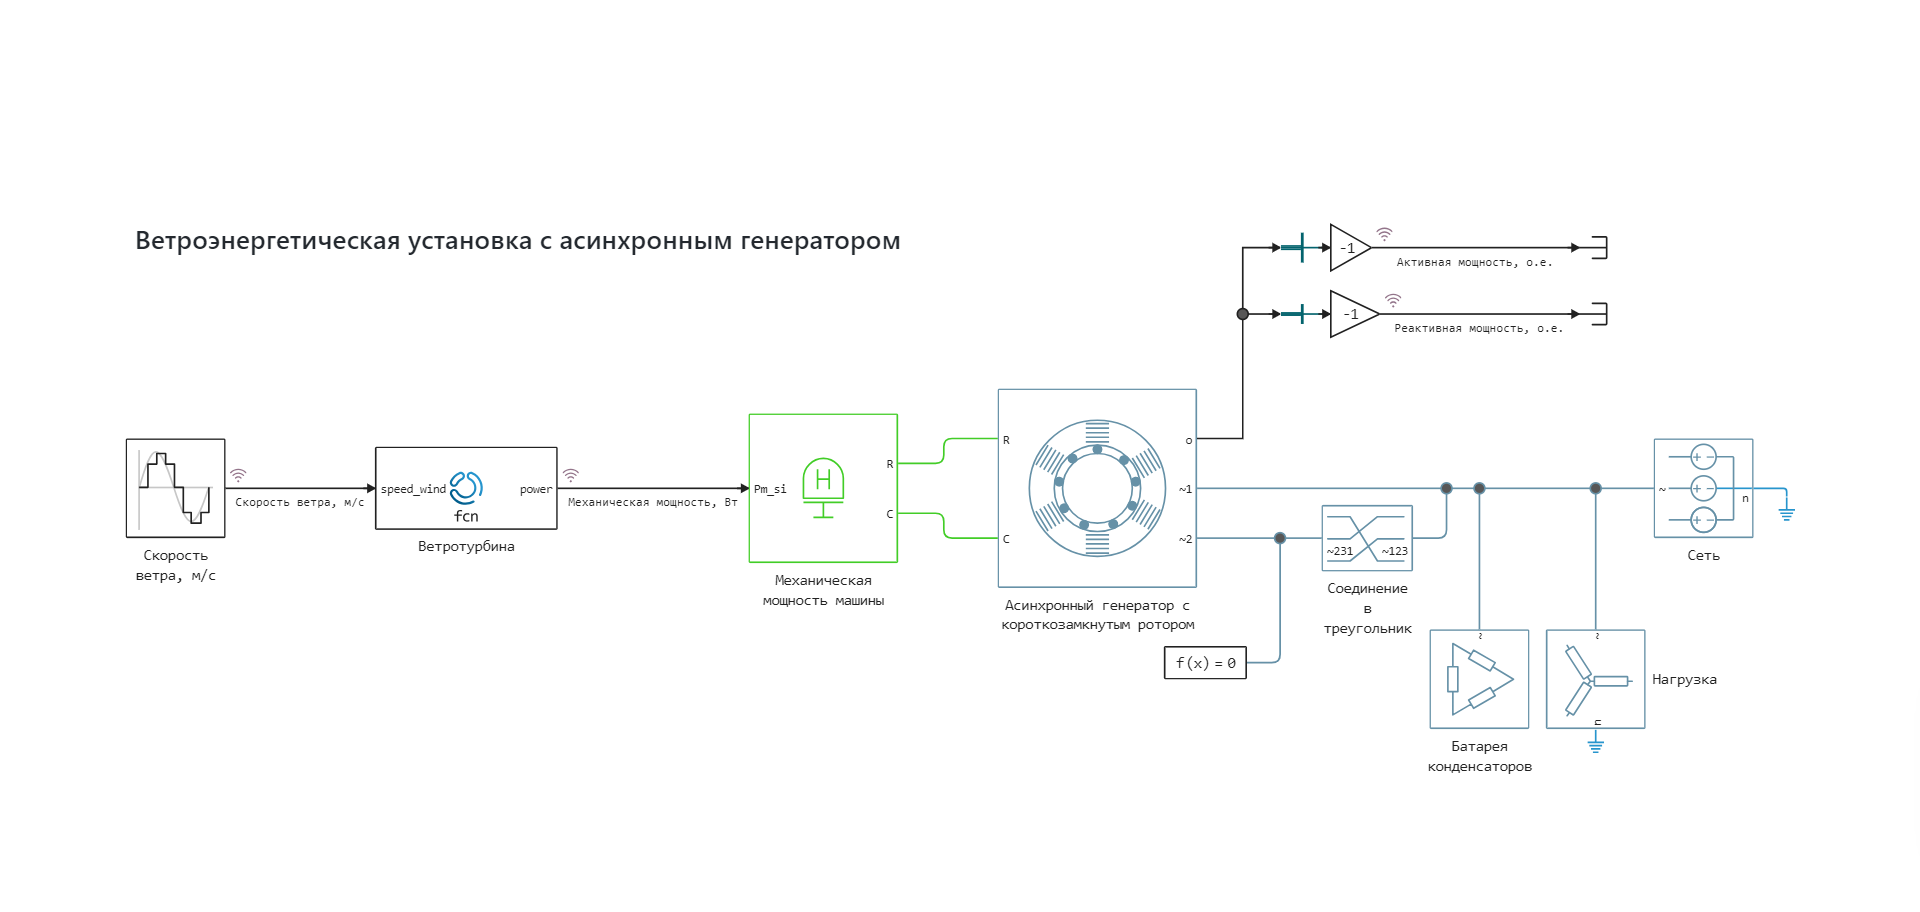
Three-phase asynchronous wind power plant
- This example shows a model of a wind power plant (wind turbine) powered by a grid.
- Asynchronous machine with a closed-loop rotor P = 150 kW is used as a wind turbine generator. Unlike synchronous machines, they have high reliability, simplicity of design and low weight, which is necessary to increase the reliability of a wind turbine.
- The asynchronous generator is connected to the mains and operates on a local load of P = 75 kW. When the generator produces more than 75 kW, the excess power is transferred to the grid. The asynchronous generator consumes reactive power, so a capacitor bank Q = 90 kVar is connected to its buses.
- The wind turbine is modeled using the Engee Function block, (https://engee.com/helpcenter/stable/base-lib-user-defined-function/engee-function.html ) reflecting the dependence of power on wind speed. Depending on the wind speed, it is taken into account that when the wind speed is below the minimum operating speed of 3 m/s or above the maximum operating speed of 23 m/s (storm shutdown), the power generated by the wind turbine is zero.
General view of the model
Implementation of the model launch using software control:
Loading the model:
In [ ]:
model_name = "asynchronous_wind_turbine_generator"
model_name in [m.name for m in engee.get_all_models()] ? engee.open(model_name) : engee.load( "$(@__DIR__)/$(model_name).engee");
Launching the uploaded model:
In [ ]:
results = engee.run(model_name)
Out[0]:
Simulation results
Importing simulation results:
In [ ]:
simulation_time = results["Wind speed, m/s"].time;
wind_speed = results["Wind speed, m/s"].value;
mechanical_power = results["Mechanical power, W"].value;
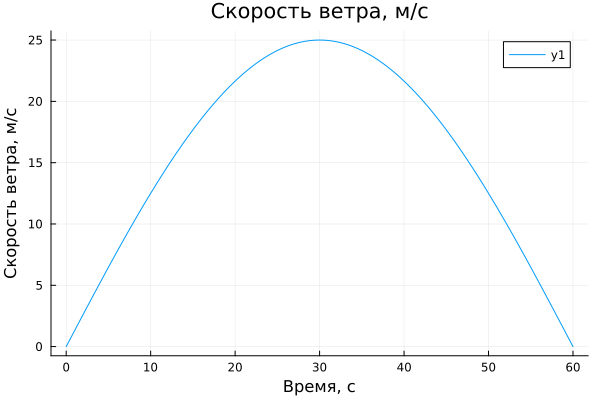
Wind speed:
In [ ]:
gr();
plot(simulation_time, wind_speed)
plot!(title = "Wind speed, m/s", ylabel = "Wind speed, m/s", xlabel="Time, c")
Out[0]:
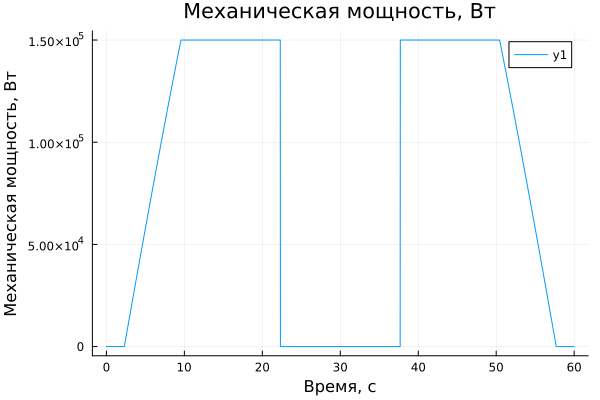
Mechanical power on the wind turbine shaft:
In [ ]:
plot(simulation_time, mechanical_power)
plot!(title = "Mechanical power, W", ylabel = "Mechanical power, W", xlabel="Time, c")
Out[0]:
Conclusions:
In this example, tools for command control of a wind turbine model with a simulation duration of 60 seconds were used. The simulation results were imported into a script and visualized using interactive graphs from the Plots library.