Permanent Magnet Synchronous motor
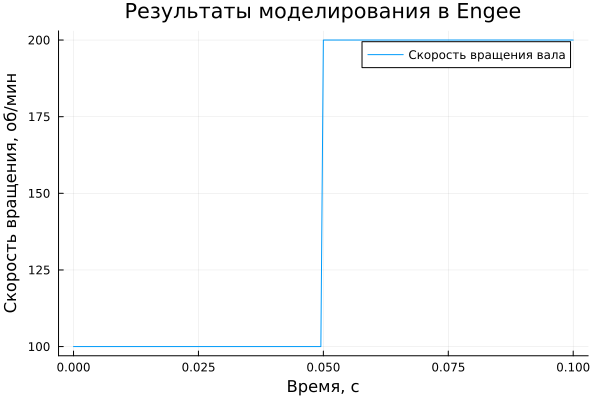
This example will demonstrate a model (model motor_pmsm.engee) of a permanent magnet synchronous motor in generator mode. The process of launching the model from the script development environment using command control and visualization of simulation results will be shown. In the simulation, the speed of rotation of the SDPM shaft changes by leaps from 100 to 200 rpm.
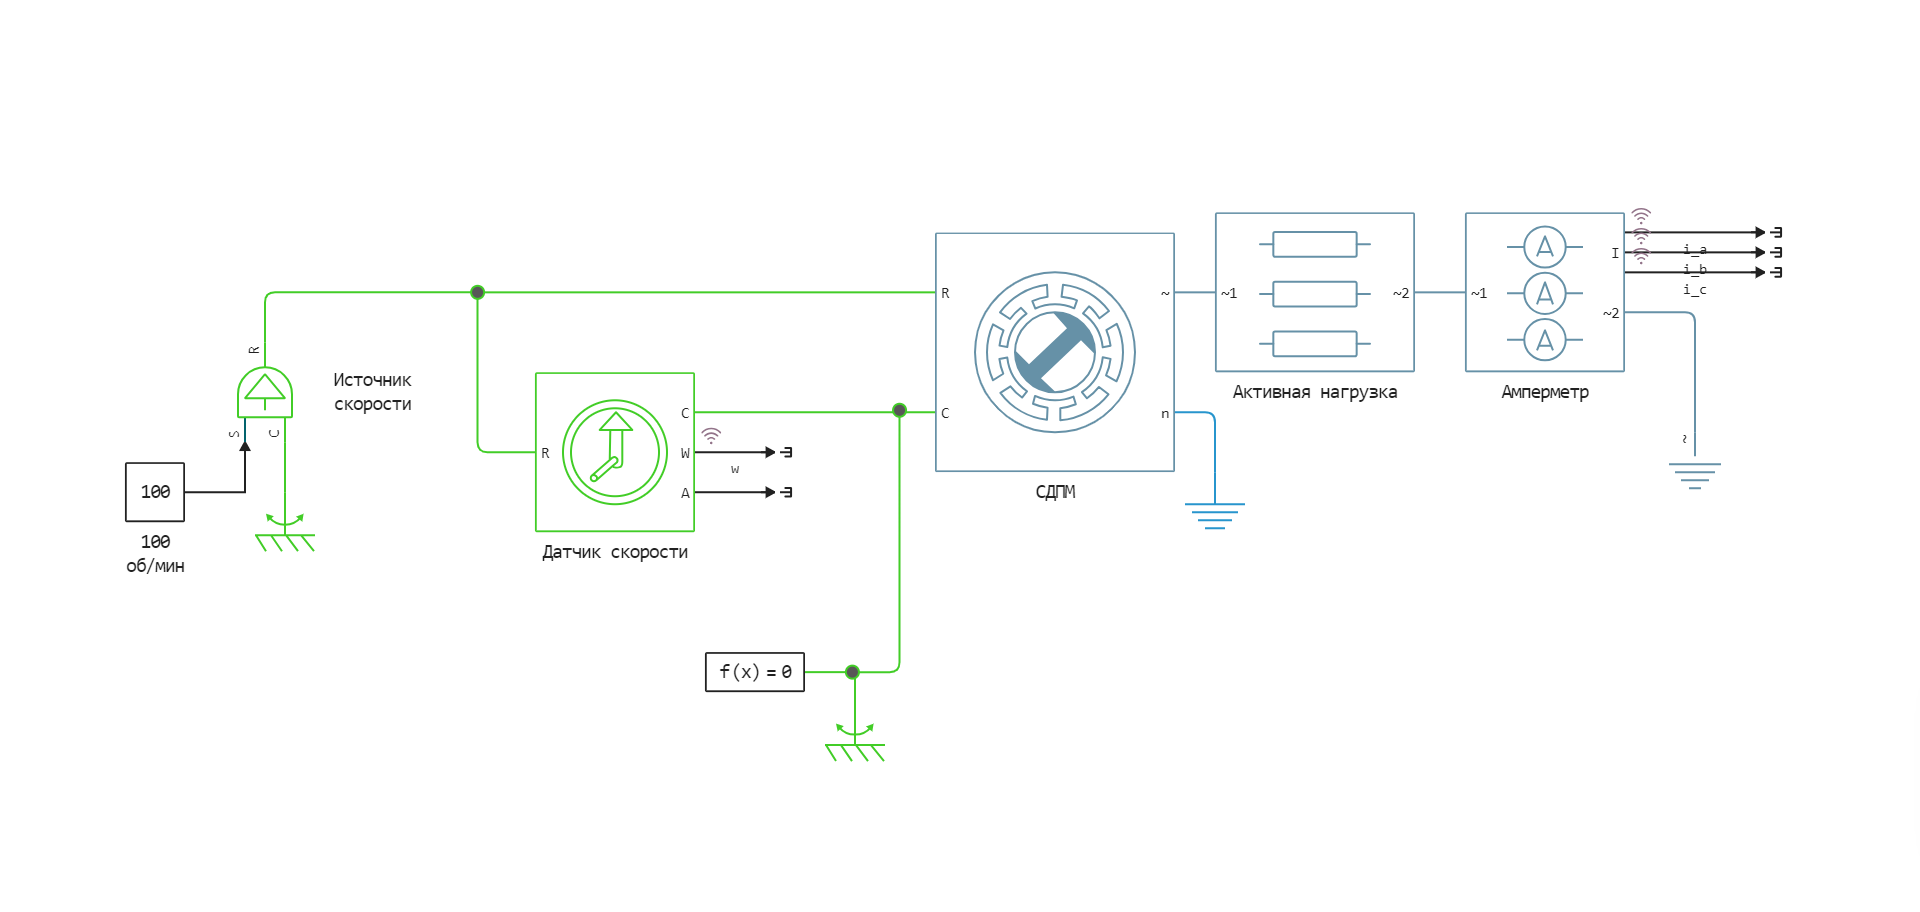
General view of the model
The Engee model:
Implementation of the model launch using software control:
Loading the necessary libraries and preparing the MATLAB core for comparing the Engee model with the Simulink model
using Plots
using DataFrames
gr();
Loading the model:
model_name = "motor_pmsm"
model_name in [m.name for m in engee.get_all_models()] ? engee.open(model_name) : engee.load( "$(@__DIR__)/$(model_name).engee");
Launching the uploaded model:
results = engee.run(model_name)
Reading data on instantaneous load current values and shaft rotation speed:
t = results["i_a"].time;
i_a = results["i_a"].value;
i_b = results["i_b"].value;
i_c = results["i_c"].value;
w = results["w"].value;
Downloading and visualizing the data obtained during the simulation
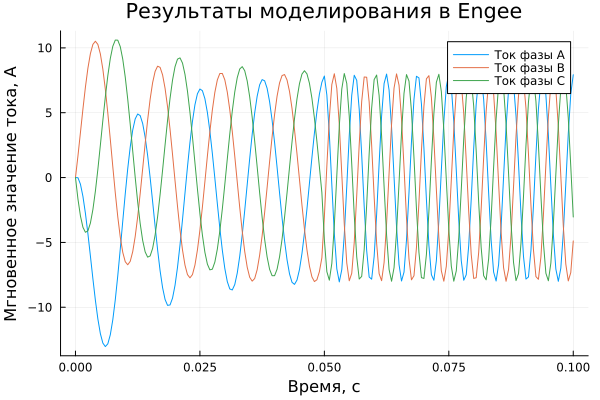
Output of a graph of the dependence of instantaneous current values on time:
plot(t, [i_a i_b i_c], label=["Phase A current" "Phase V current" "Phase C current"])
plot!(title = "Simulation results in Engee", ylabel = "The instantaneous value of the current, And", xlabel="Time, c")
Output of a graph of the dependence of the shaft rotation speed on time:
plot(t, w, label="Shaft rotation speed")
plot!(title = "Simulation results in Engee", ylabel = "Rotation speed, rpm", xlabel="Time, c")
Conclusions:
In this example, tools were used for command control of a permanent magnet synchronous motor (DSM) model. The simulation results were imported into a script and visualized using interactive graphs from the Plots library.