A simple linear regression application
Let's illustrate the development of an application for data entry and plotting, which allows you to get a trend and copy the formula of a linear function approximating it.
Starting and stopping the application
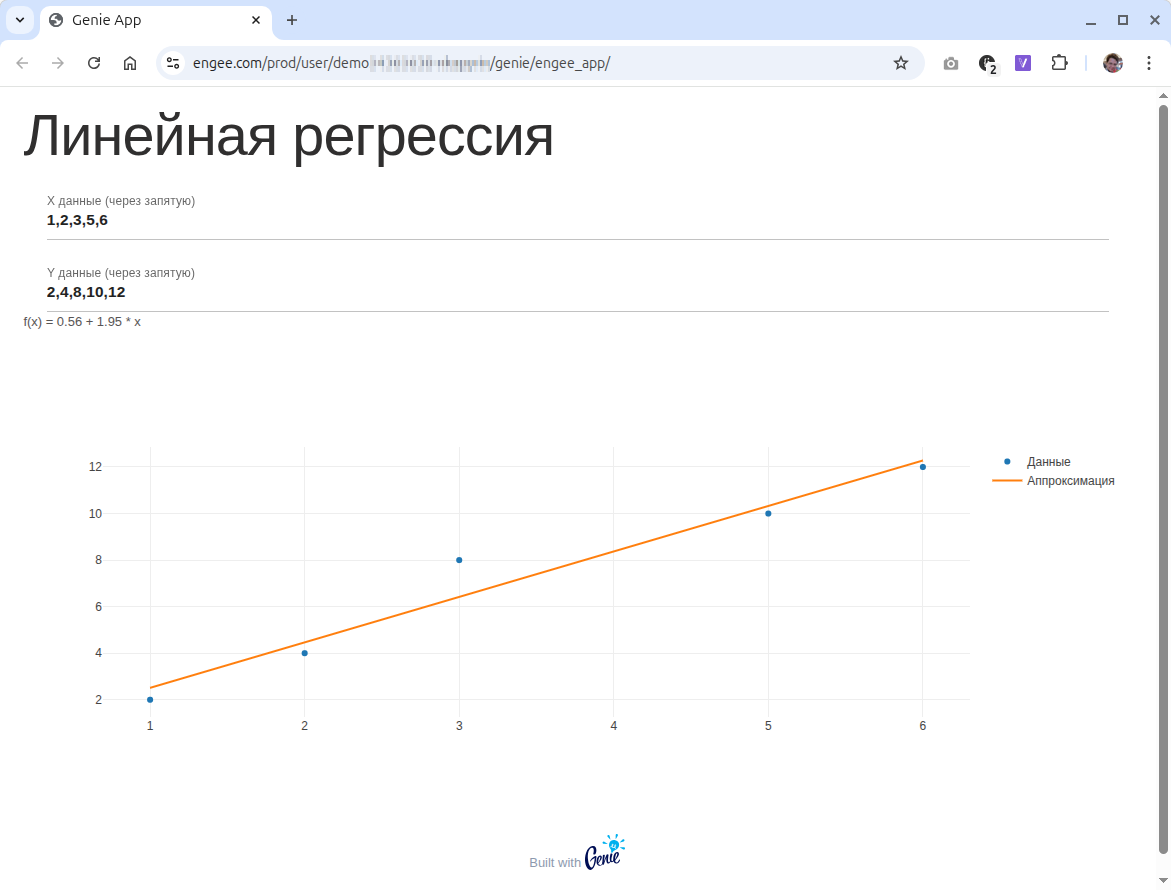
There is a file in the folder with the example app.jl, which contains the code of a minimal application for building a trend based on user data. The graph allows you to visually evaluate the correctness of the approximation, and for further manipulations, the user receives an equation in the form of a function. f(x) = a*x + b, which can be inserted into a terminal or code cell and executed as an element of a user program.
In this example, we are not using the Engee variable space or model management (all of this is available through the library using EngeeWe will only show you how to integrate the code of a Julia server application with the HTML code of a web page.
You can launch the application and get a link where you can open it in a separate window (while the "server side" on Julia remains active).
genie_app = engee.genie.start("$(@__DIR__)/app.jl", log_file="log.txt");
display("text/html", """<a href="$(string(genie_app.url))" target="_blank">Open in a separate window</a>""")
To stop the application for debugging purposes or just to restart, you need the following command, which you need to uncomment in order to execute:
engee.genie.stop("$(@__DIR__)/app.jl");
The code of an empty Engee application
Let's look at what such a program consists of. Minimum file content app.jl given below.
using GenieFramework

@app begin
    #
end

function ui()
    [
        h1("Линейная регрессия")
    ]
end

@page("/", ui)
We can see the beginning of the application, where on the application layout ui() there is a header, but an empty section @app it does not contain reactive variables and functions.
A minimal application that outputs a graph
The next step in the development is to fill the layout with custom controls, and the section @app- reactive variable functions linked to updating GUI elements or the reactive variables themselves:
using GenieFramework, PlotlyBase

# Начальные демонстрационные данные
const TEST_VEC_X = -10:10
const TEST_VEC_Y = (-10:10).^2 + 10 .* rand(21) .- 5

@app begin
    @in x_data = ""
    @in y_data = ""
    @out message = "Введите данные"
    @out plot_data = [scatter(x=TEST_VEC_X, y=TEST_VEC_Y, mode="markers", name="Данные")]
end

function ui()
    [
        h1("Линейная регрессия"),
        textfield("X данные (через запятую)", :x_data),
        textfield("Y данные (через запятую)", :y_data),
        p("{{message}}"),
        plot(:plot_data)
    ]
end

@page("/", ui)
So far, this code does nothing but display test data, but it already has reactive variables. The Engee toolkit takes care of updating the values of these variables on the client and server sides (keep in mind that the JavaScript application is running on the client side, and Julia is running on the server side).
This application works, but in order to update the graph, we will need input validation and processing functions (convert string input into a vector of values), performing linear regression (function linear_regression based on the method a, b = A \ vec_y), plotting data and trend (create_plot_traces) and a function that combines these three actions (update_plot_data). You will find them in the file app.jl.
Conclusion
We looked at how to organize a minimalistic application with a graph, a couple of string parameters and a line for displaying a status message. The elements are easy to swap, and the functionality of the application is easy to refine by adding code to Julia or привязав to the external libraries application.