Data Approximation (Engee application)
We present a toolkit for developing our own applications using the example of the Data Approximation tool.
The purpose of this application is
The Data Approximation tool is designed to help you find good functions for approximating input data vectors.
The purpose of this particular example is to show and discuss application development techniques in Engee using GenieFramework.
Launching the app
In the folder with this example you will find the file app.jl, which we will launch as a separate application in Engee with the following commands:
genie_app = engee.genie.start("$(@__DIR__)/app.jl", open_url=true, log_file="log.txt");
In the mode open_url=true the app starts automatically.
The application can also be opened in a separate window.:
# display("text/html", """<a href="$(string(genie_app.url))" target="_blank">Open in a separate window</a>""")
Or it can be displayed inside an interactive script.:
# display(MIME("text/html"), """<iframe src="$(string(genie_app.url))" width="1100" height="680" style="border: none;"></iframe>""";)
To stop the application, run the following command, uncomenting it:
engee.genie.stop("$(@__DIR__)/app.jl");
Creating input vectors
Let's create the input data that will be required for the application to work.:
# The polynomial function
v1 = 1:5
v2 = (v1.^3 .+ 3v1 .- 5)./150;

# The exhibitor
v3 = 3 .* exp.(v1 .- 4);

# The usual logistic regression
n = 1000
xr = randn(n)
yr = Float32.((1.0 ./ (1.0 .+ exp.(-xr))) .> rand(n))

# Step function (also for logistic regression)
yr1 = Float32.(xr .> (minimum(xr) + 0.5*abs(maximum(xr)-minimum(xr))))

# Gaussian function (singular - careful, it's still a linear regression)
normal_pdf(x; μ=0, σ=1) = exp(-(x-μ)^2/(2σ^2)) / (σ * sqrt(2π))
xn = collect(-3:0.1:3);
yn = normal_pdf.(xn);
yn1 = normal_pdf.(xn, μ=1, σ=0.001);
Plotting the found function
The found functions can be copied from a line in the application and pasted into an interactive script cell to get the output data.:
f(x) = 1/(1+exp(-(3.99922 + 8.62808 * x)))

plot(-4:0.1:4, f, lw=3, leg=false)
scatter!(xr,yr1)
How does it work?
Here is a small demo with the test vectors given above.:
Comments about the program's operation
Any data that is added to the vectors inside the tool via a function call can be used as input vectors. collect().
Part of the regression tasks is performed using the method of named squares, and part is performed using gradient descent with a moment. This gives some confidence in the convergence of the regression, but due to the limited number of steps of iterative algorithms, the best approximation may not be achievable for some datasets. It is worth increasing the number of steps in the tool code.
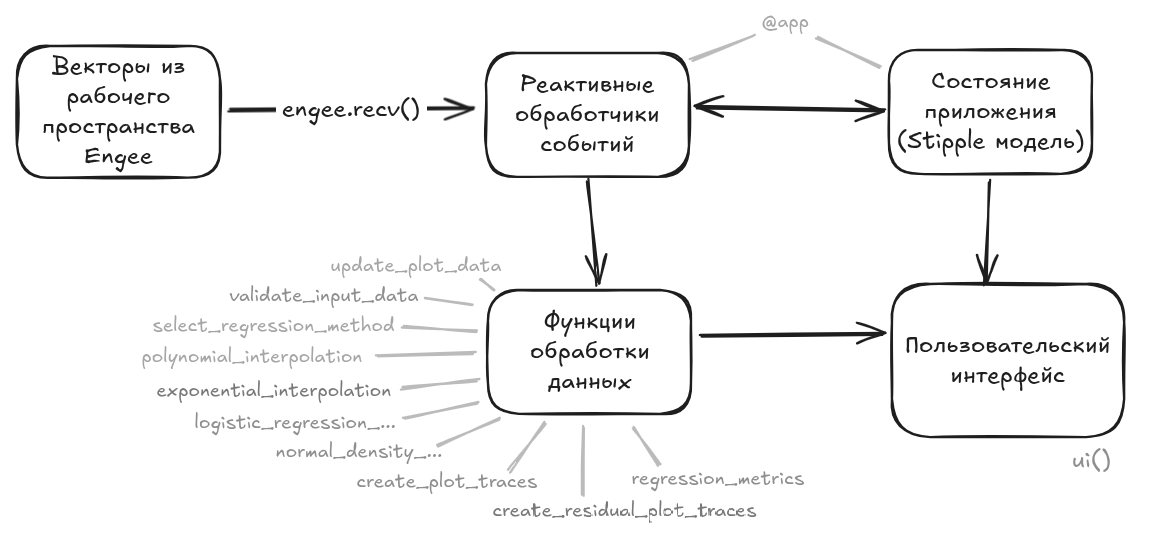
If you go into the code of the tool, you will see a fairly standard application structure.:
Conclusion
We hope for your feedback to make the tool more useful and eliminate errors.