The model of the automatic pressure control system (SARD) in the cockpit
The automatic pressure control system (SARD) in the cockpit is designed to maintain safe pressure inside the cabin at different stages of the flight (takeoff, cruise flight, landing).
Model diagram:
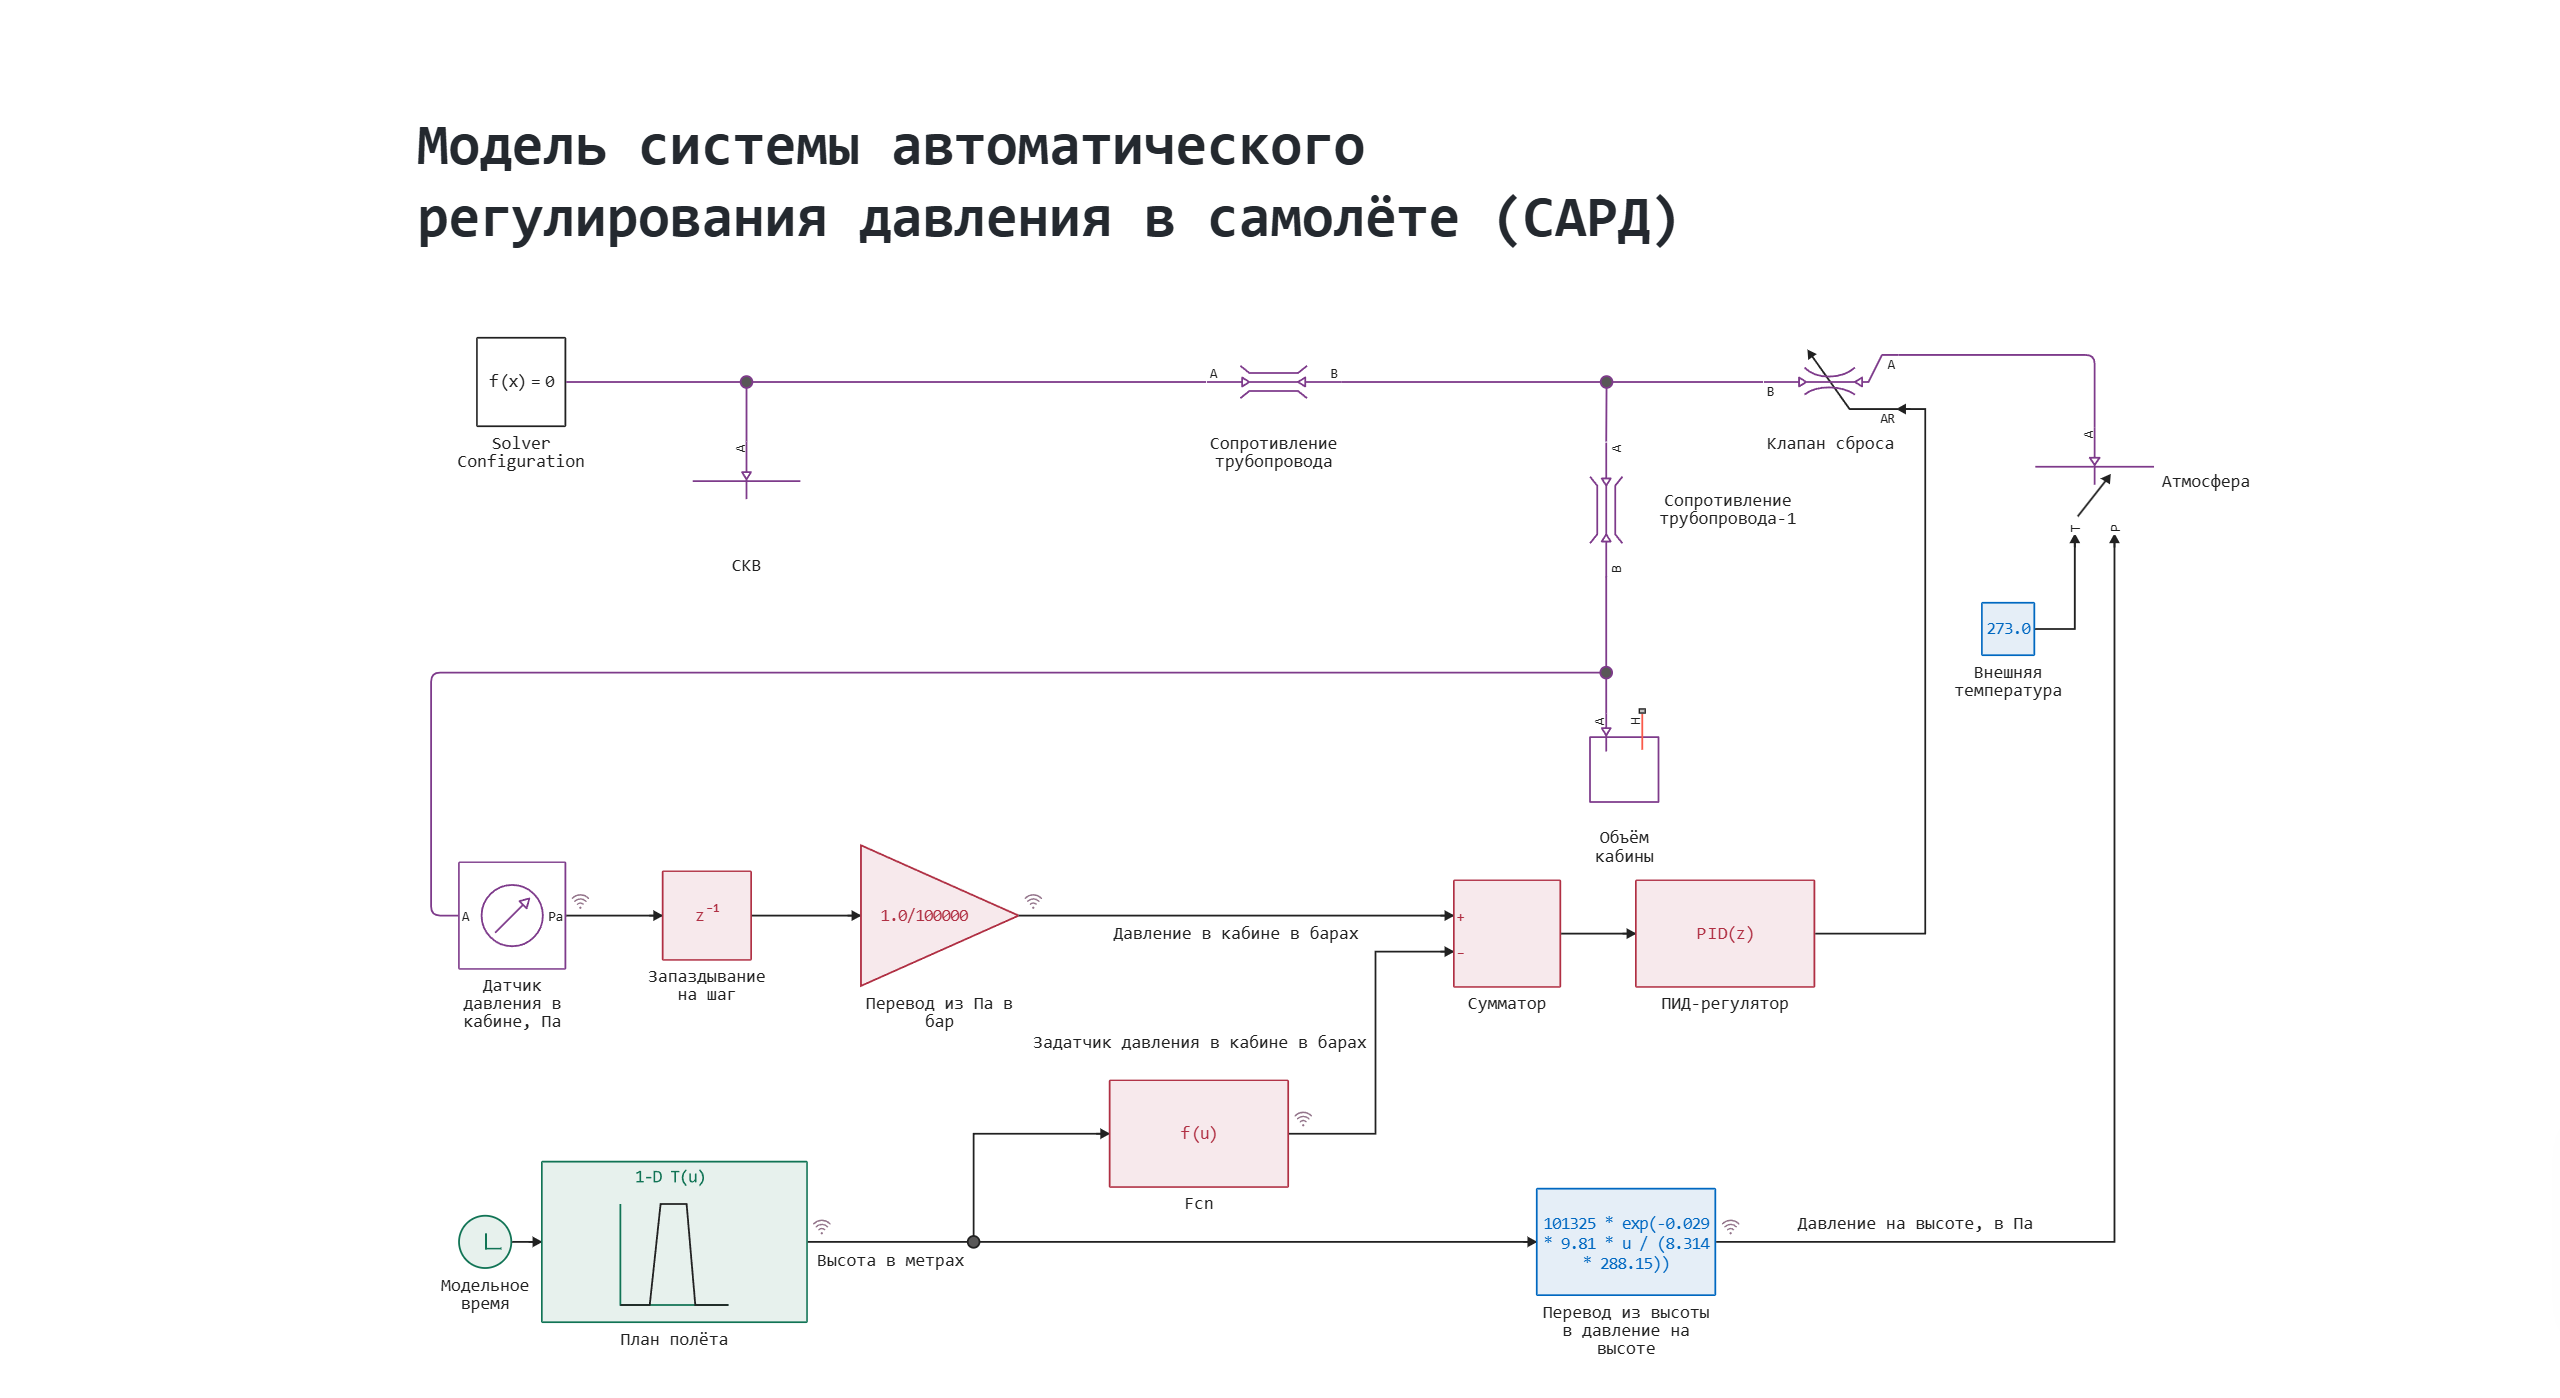
The physical part of the system
The SLE unit simulates the supply of air from an air conditioning system with constant pressure and temperature.
Block Pipeline resistance (2 blocks) – simulates pressure losses in air lines.
The Cabin Volume unit is a dynamic cabin model where pressure varies depending on air injection/discharge.
Block Relief valve – regulates the discharge of excess pressure into the atmosphere, which is described by the block The atmosphere.
The management system
The control system in the model consists of red blocks, which include:
- cabin pressure sensor in bars - converts height in meters to pressure at the same height, according to the law: where — height
- adder - calculates the mismatch signal between the setpoint**m and the measured value,* *
- PID controller,
- delay unit,
- the ** transfer unit from Pa to bar**.
External conditions
The external conditions are defined by the blue blocks. Assumption: the temperature is constant. The pressure is determined by the unit Conversion from altitude to pressure at altitude according to the law: where — height.
Flight plan
The blocks representing the flight plan describe how the altitude of the aircraft will change depending on the time. They are green in the diagram.
At the entrance of the block Flight plan the model time is given, the output signal of the unit is the altitude value in meters.
Defining the function to load and run the model:
function start_model_engee()
    try
        engee.close("pressure_control_system_in_aircraft", force=true) # closing the model
        catch err # if there is no model to close and engee.close() is not executed, it will be loaded after catch.
            m = engee.load("$(@__DIR__)/pressure_control_system_in_aircraft.engee") # loading the model
        end;

    try
        engee.run(m, verbose=true) # launching the model
        catch err # if the model is not loaded and engee.run() is not executed, the bottom two lines after catch will be executed.
            m = engee.load("$(@__DIR__)/pressure_control_system_in_aircraft.engee") # loading the model
            engee.run(m, verbose=true) # launching the model
        end
end
Running the simulation
start_model_engee();
Writing simulation data to variables:
t = simout["pressure_control_system_in_aircraft/Cabin pressure sensor in bars"].time[:]
control_pressure = simout["pressure_control_system_in_aircraft/Cabin pressure sensor in bars"].value[:]
cabin_pressure_bar = simout["pressure_control_system_in_aircraft/Cabin pressure in bars"].value[:]
altitude = simout["pressure_control_system_in_aircraft/Height in meters"].value[:]
external_pressure = simout["pressure_control_system_in_aircraft/Pressure at altitude, in Pa"].value[:]
cabin_pressure_pa = simout["pressure_control_system_in_aircraft/Cabin pressure sensor, Pa.1"].value[:];
Data visualization
using Plots
The flight plan includes 5 stages:
- Standing on the ground (1355 seconds).
- Takeoff and climb (500 seconds).
- Cruise flight (1200 seconds).
- Descent and landing (400 seconds).
- Parking after flight (1531 seconds).
plot(t, altitude, linewidth=2, xlabel="Time, from", ylabel="Height, m", title="Flight plan", legend=false)
In accordance with the change in flight altitude, the external pressure changes, as well as the pressure in the cabin according to the law of regulation.:
plot(t, external_pressure, linewidth=2, label="Pressure at flight altitude")
plot!(t, cabin_pressure_pa, linewidth=2, label="Cabin pressure", xlabel="Time, from", ylabel="Pressure, Pa", legend=:bottomright)
This pressure difference is maintained for a comfortable stay of passengers on the plane. But the pressure in the cabin is slightly less than the pressure under normal conditions, this is determined by the strength requirements for the aircraft structure.
Graph of set and measured cabin pressure:
plot(t, control_pressure, linewidth=2, label="Preset cabin pressure")
plot!(t, cabin_pressure_bar, linewidth=2, label="Measured cabin pressure", xlabel="Time, from", ylabel="Pressure, bar", legend=:bottomright)
Conclusions:
In this example, a model of an automatic pressure control system in an airplane cabin was considered. After analyzing the graphs, it can be concluded that the regulator maintains the pressure at a preset level at all stages of the flight.