Simulation of a ventilation system in a building with a temperature control system
This example demonstrates the simulation of a ventilation system in a building with a temperature control system.
How the model works
The model of the building ventilation system is described by blocks of physical modeling libraries, such as "Gas" and "Heat".
Subsystems System parameters and external conditions and The temperature control system consist of directional blocks of the basic library.
The subsystem Ventilation system consists of blocks of the Gaz library, as well as blocks of the basic library.
The blocks Zone 1, Zone 2, Zone 3 and Zone 4 represent air volumes in different rooms.
The cooled air enters Zone 1 from The ventilation unit and is distributed to Zone 2 and 4 , then entering Zone 3, from which it is released into the environment through The hood or is sent back to the Ventilation unit through Air duct.
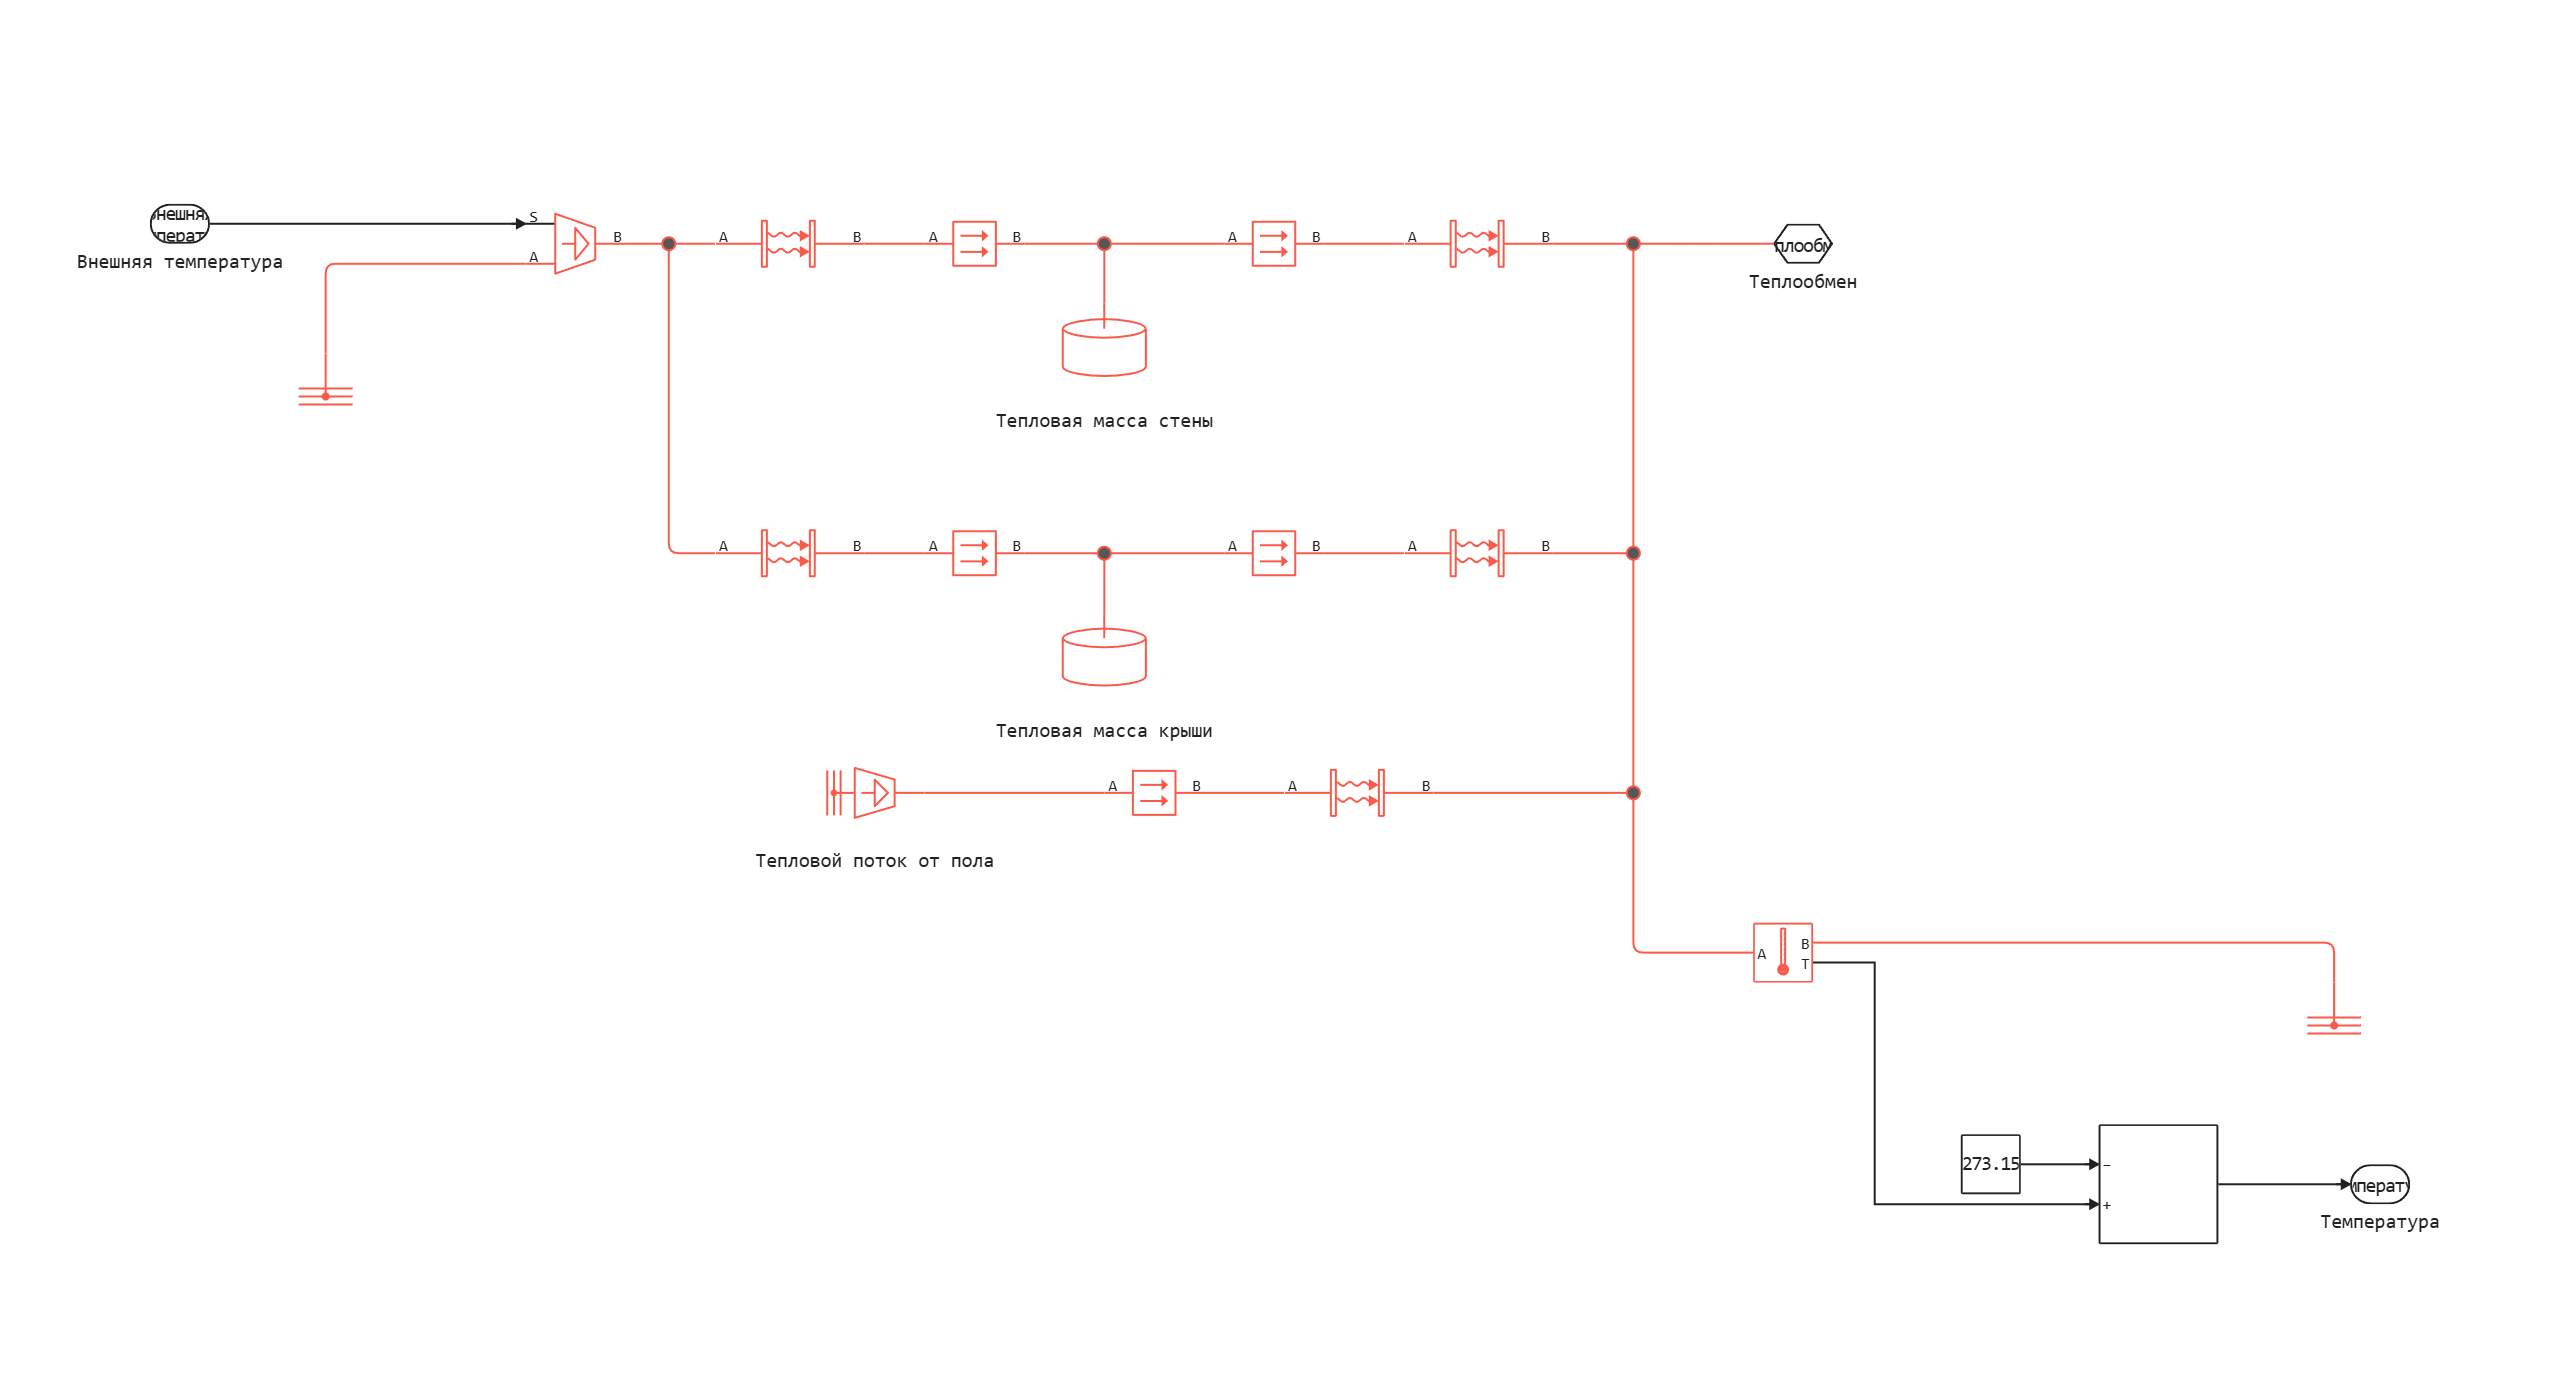
Model diagram:
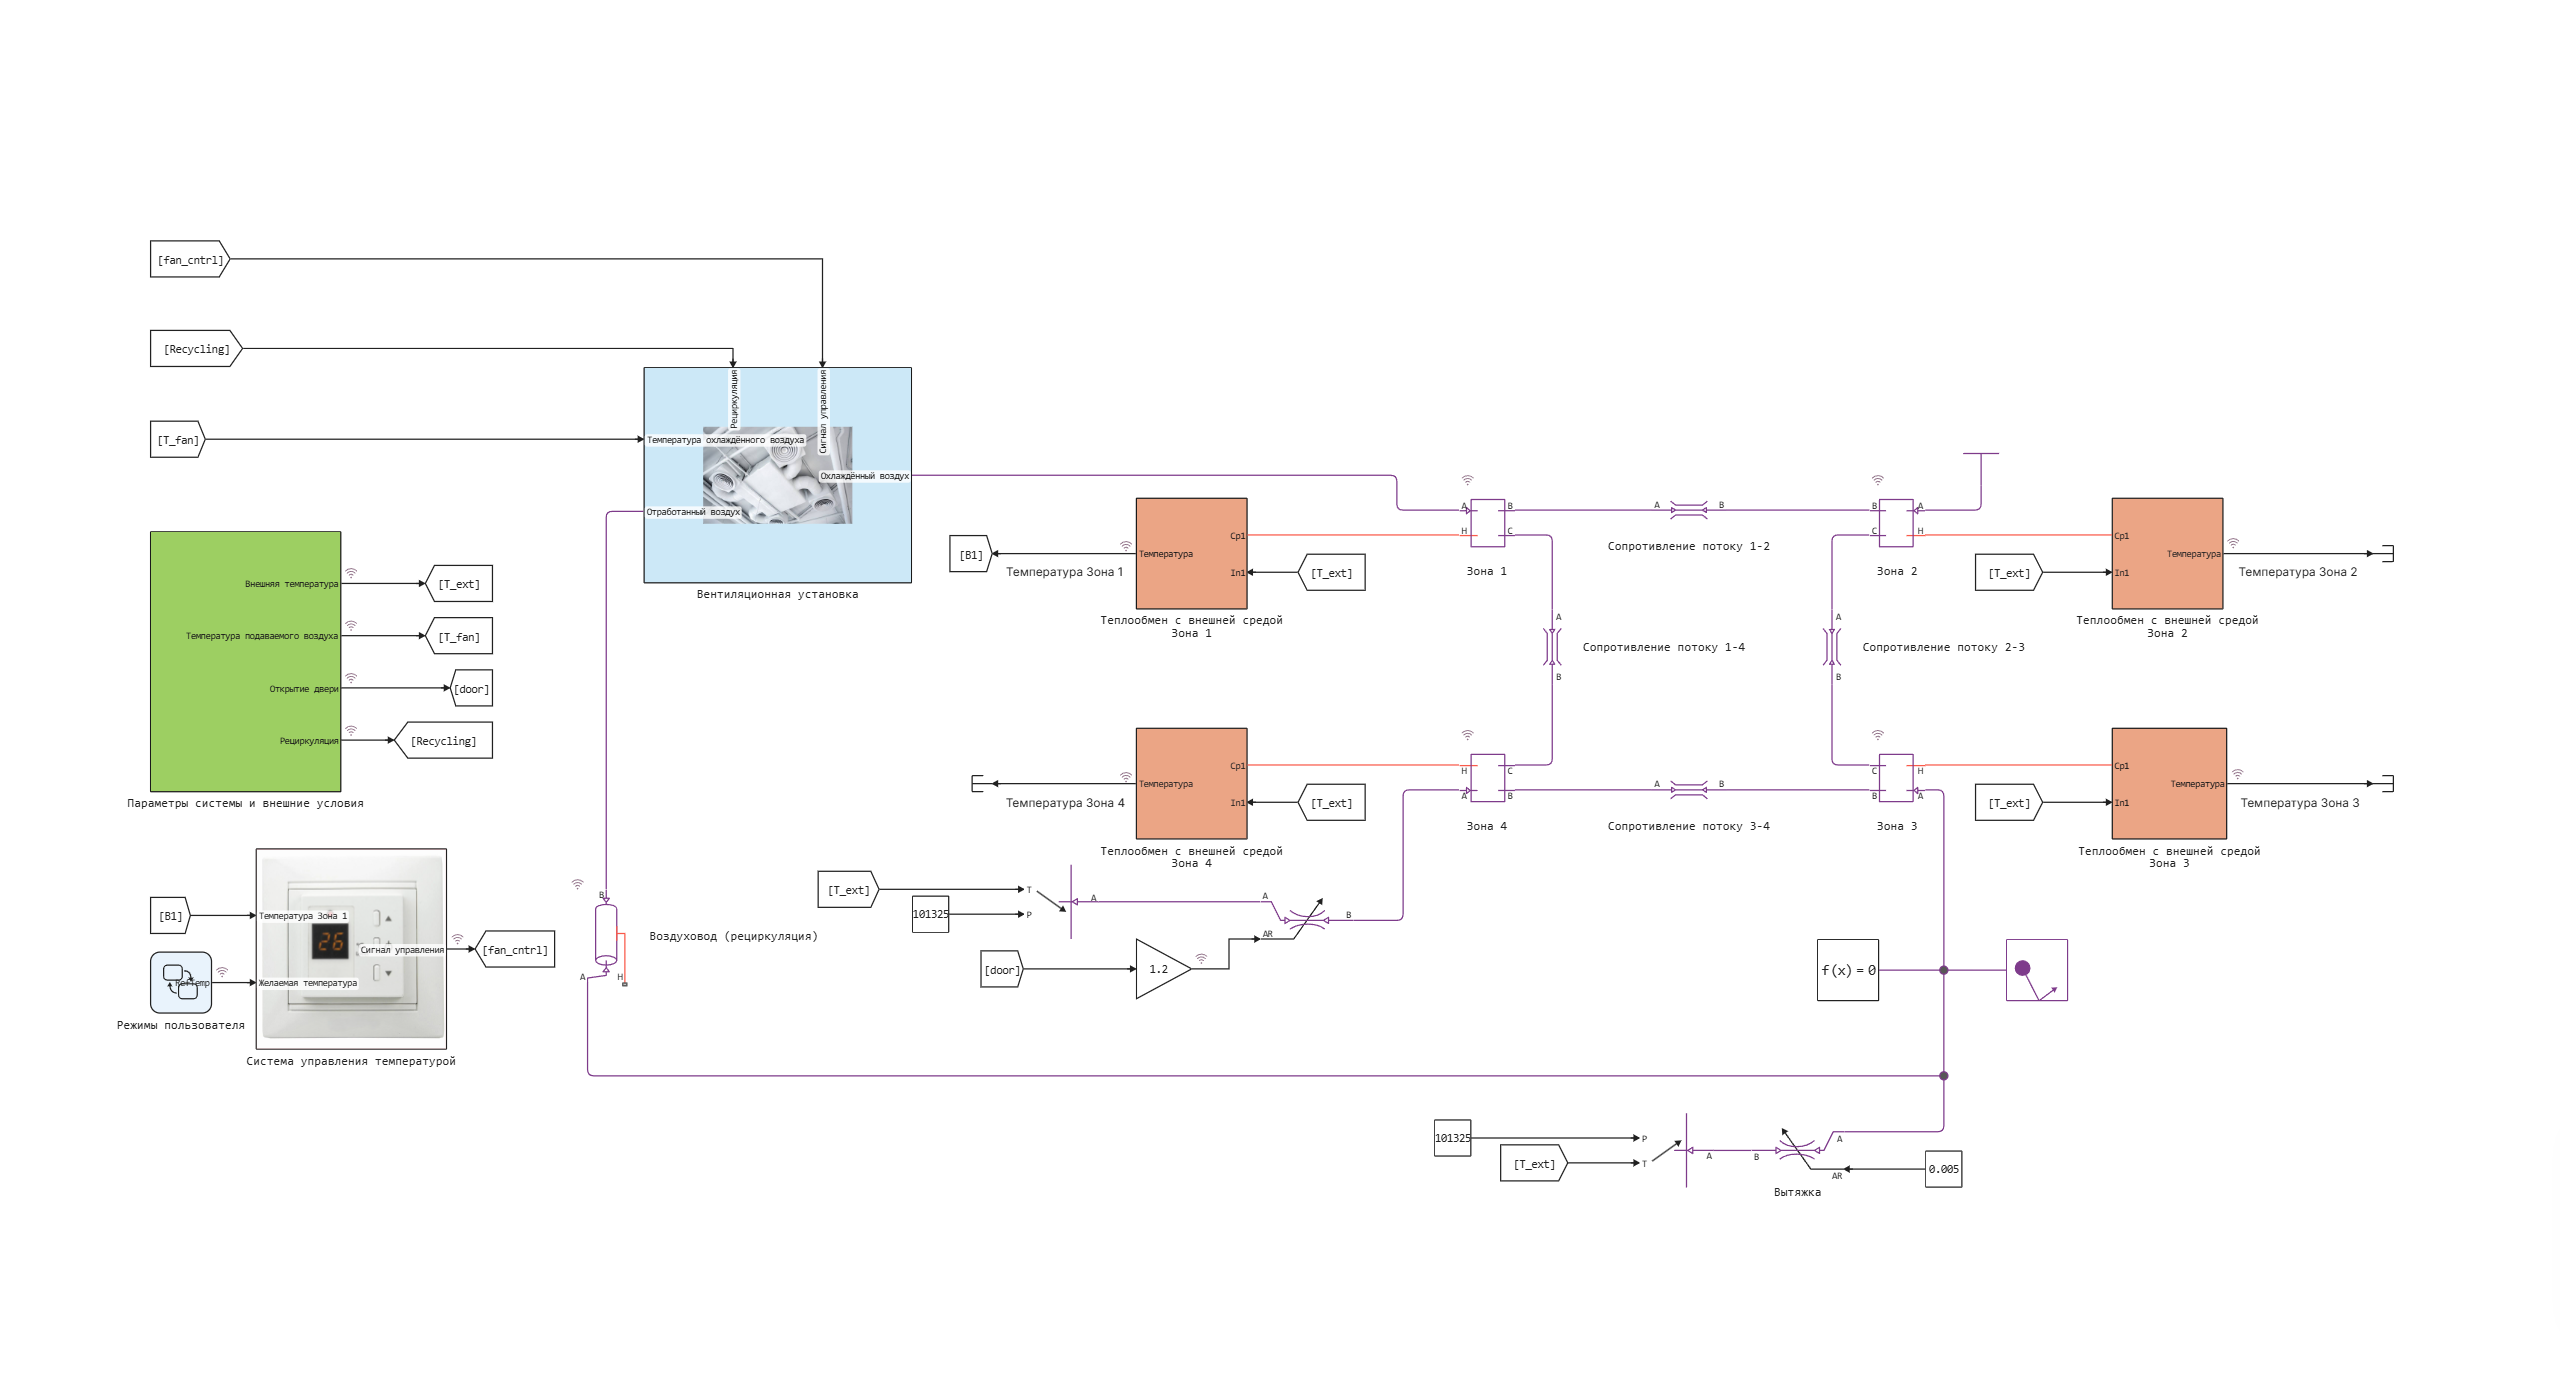
Temperature control takes place in Zone 1, the sensor sends a signal to The temperature control system, where a mismatch signal is calculated and a control signal is generated. The control signal enters the subsystem Ventilation unit, where it passes through the unit Tabular function to calculate the required mass flow rate of the unit Fan.
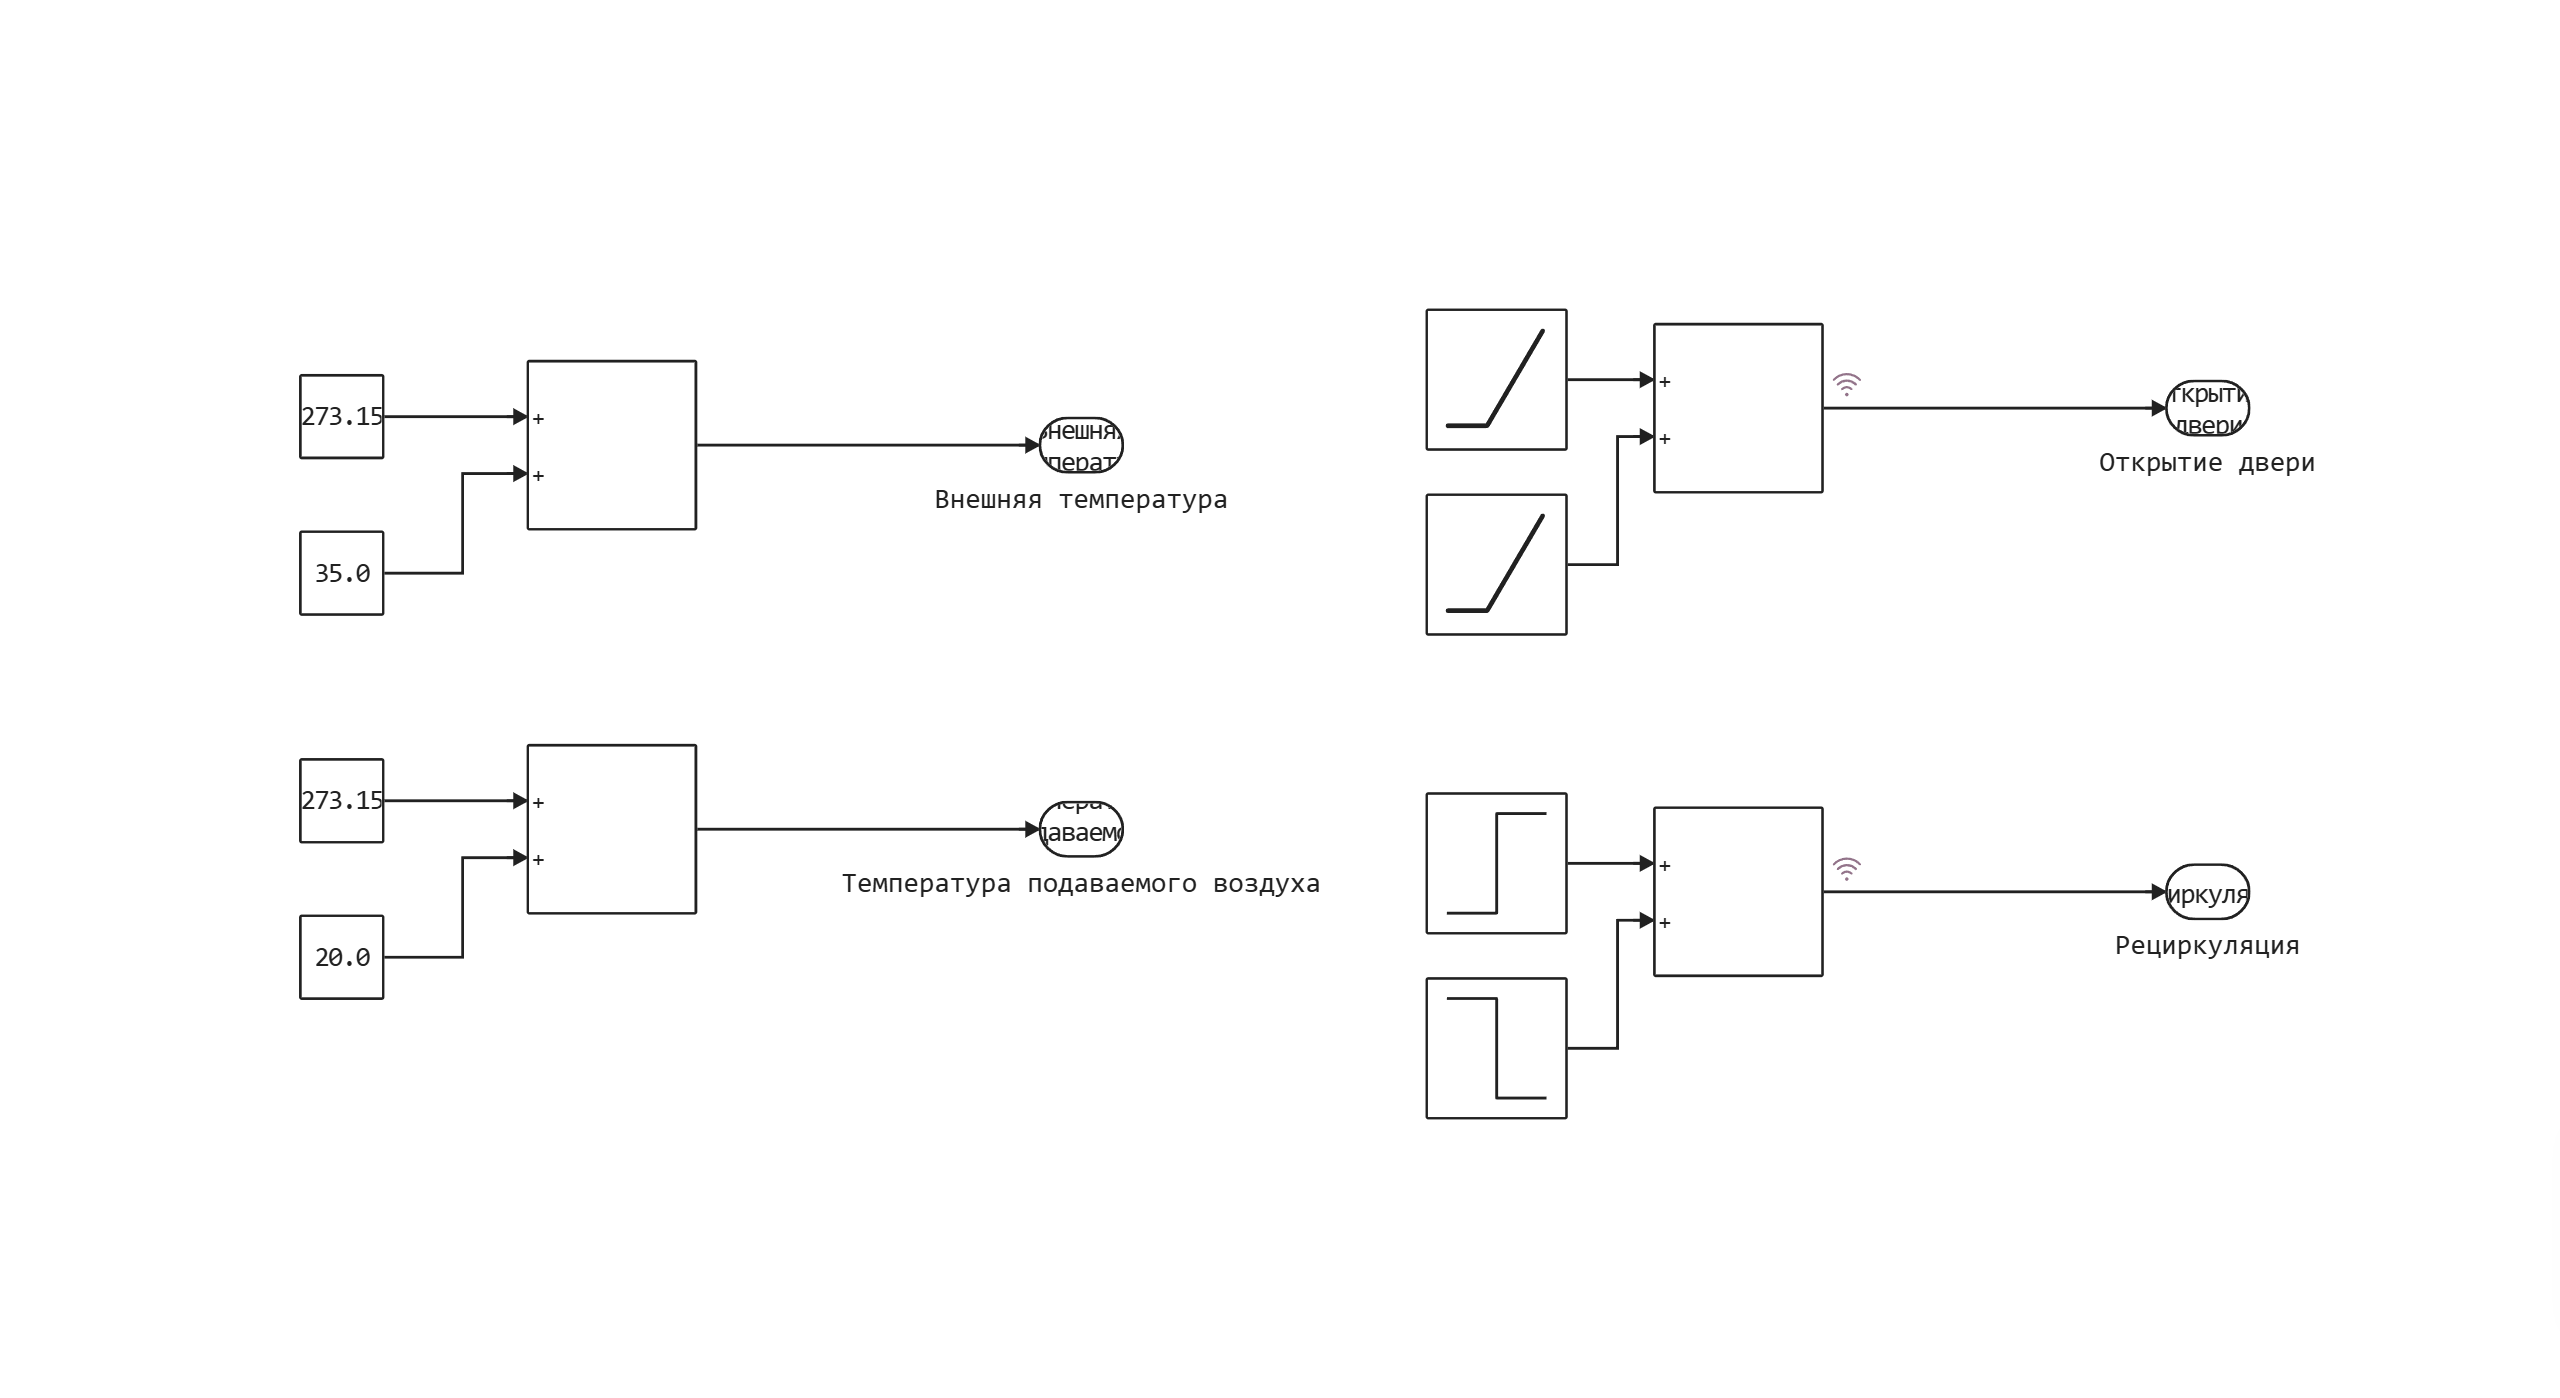
Subsystem "System parameters and external conditions"
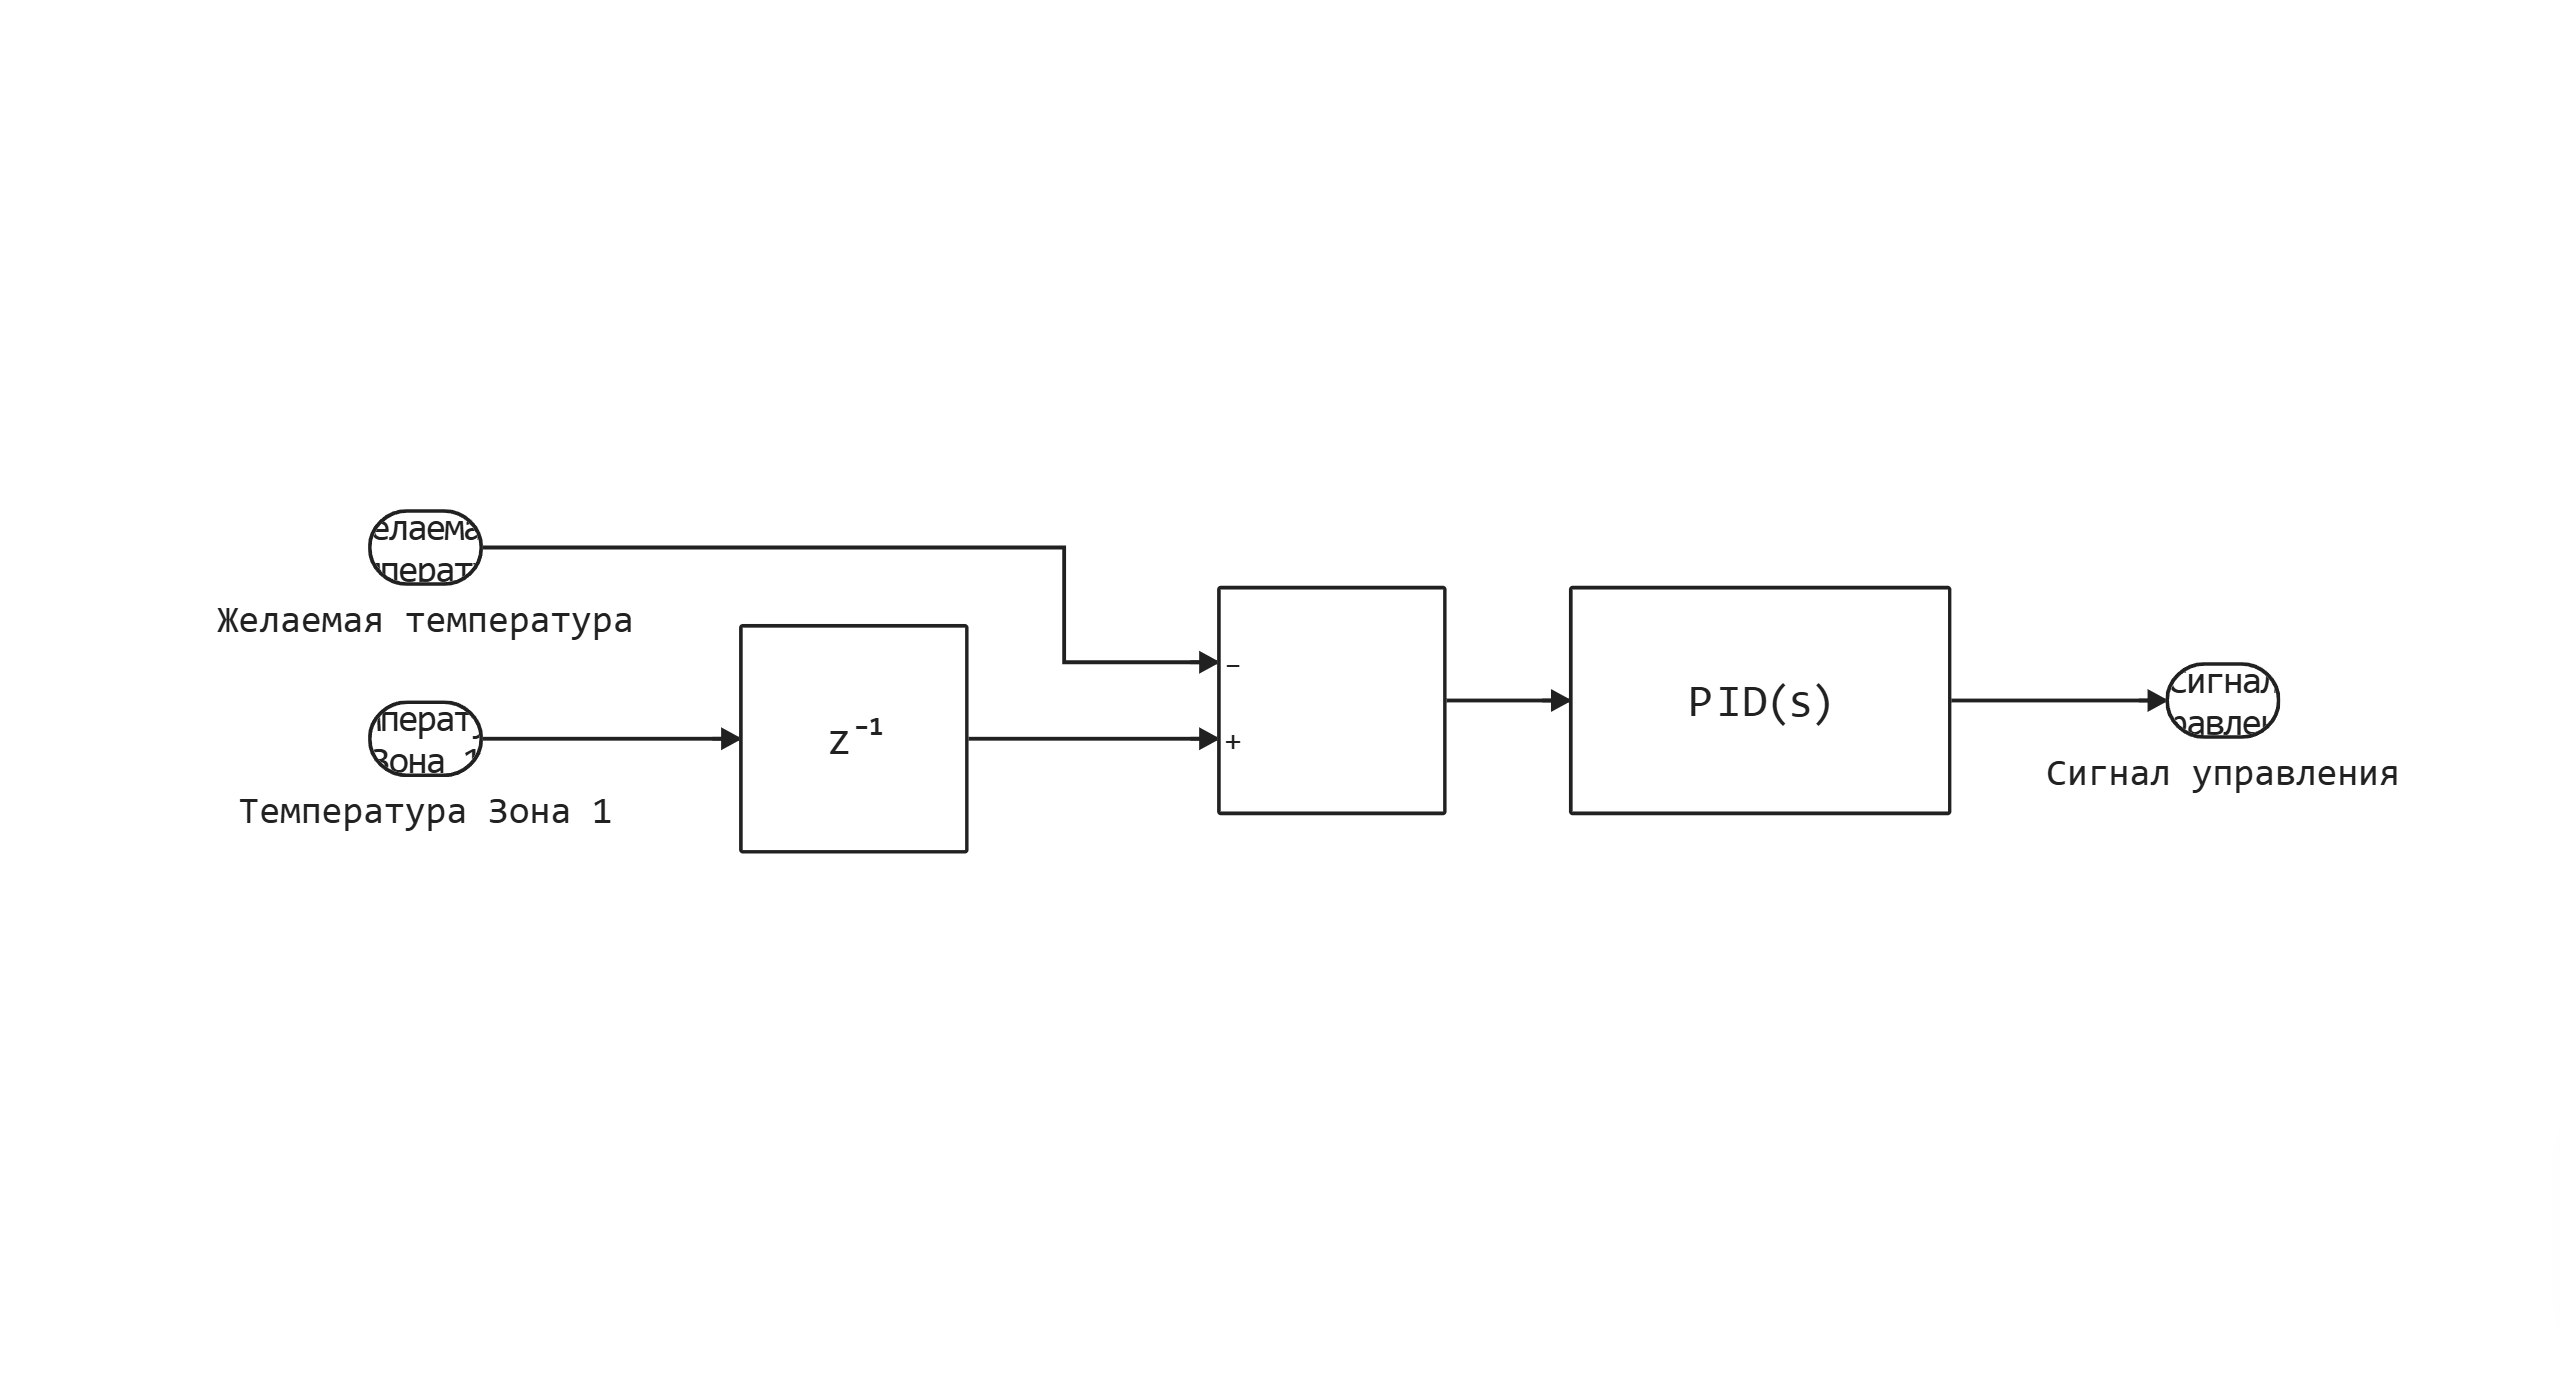
Subsystem "Temperature control system"
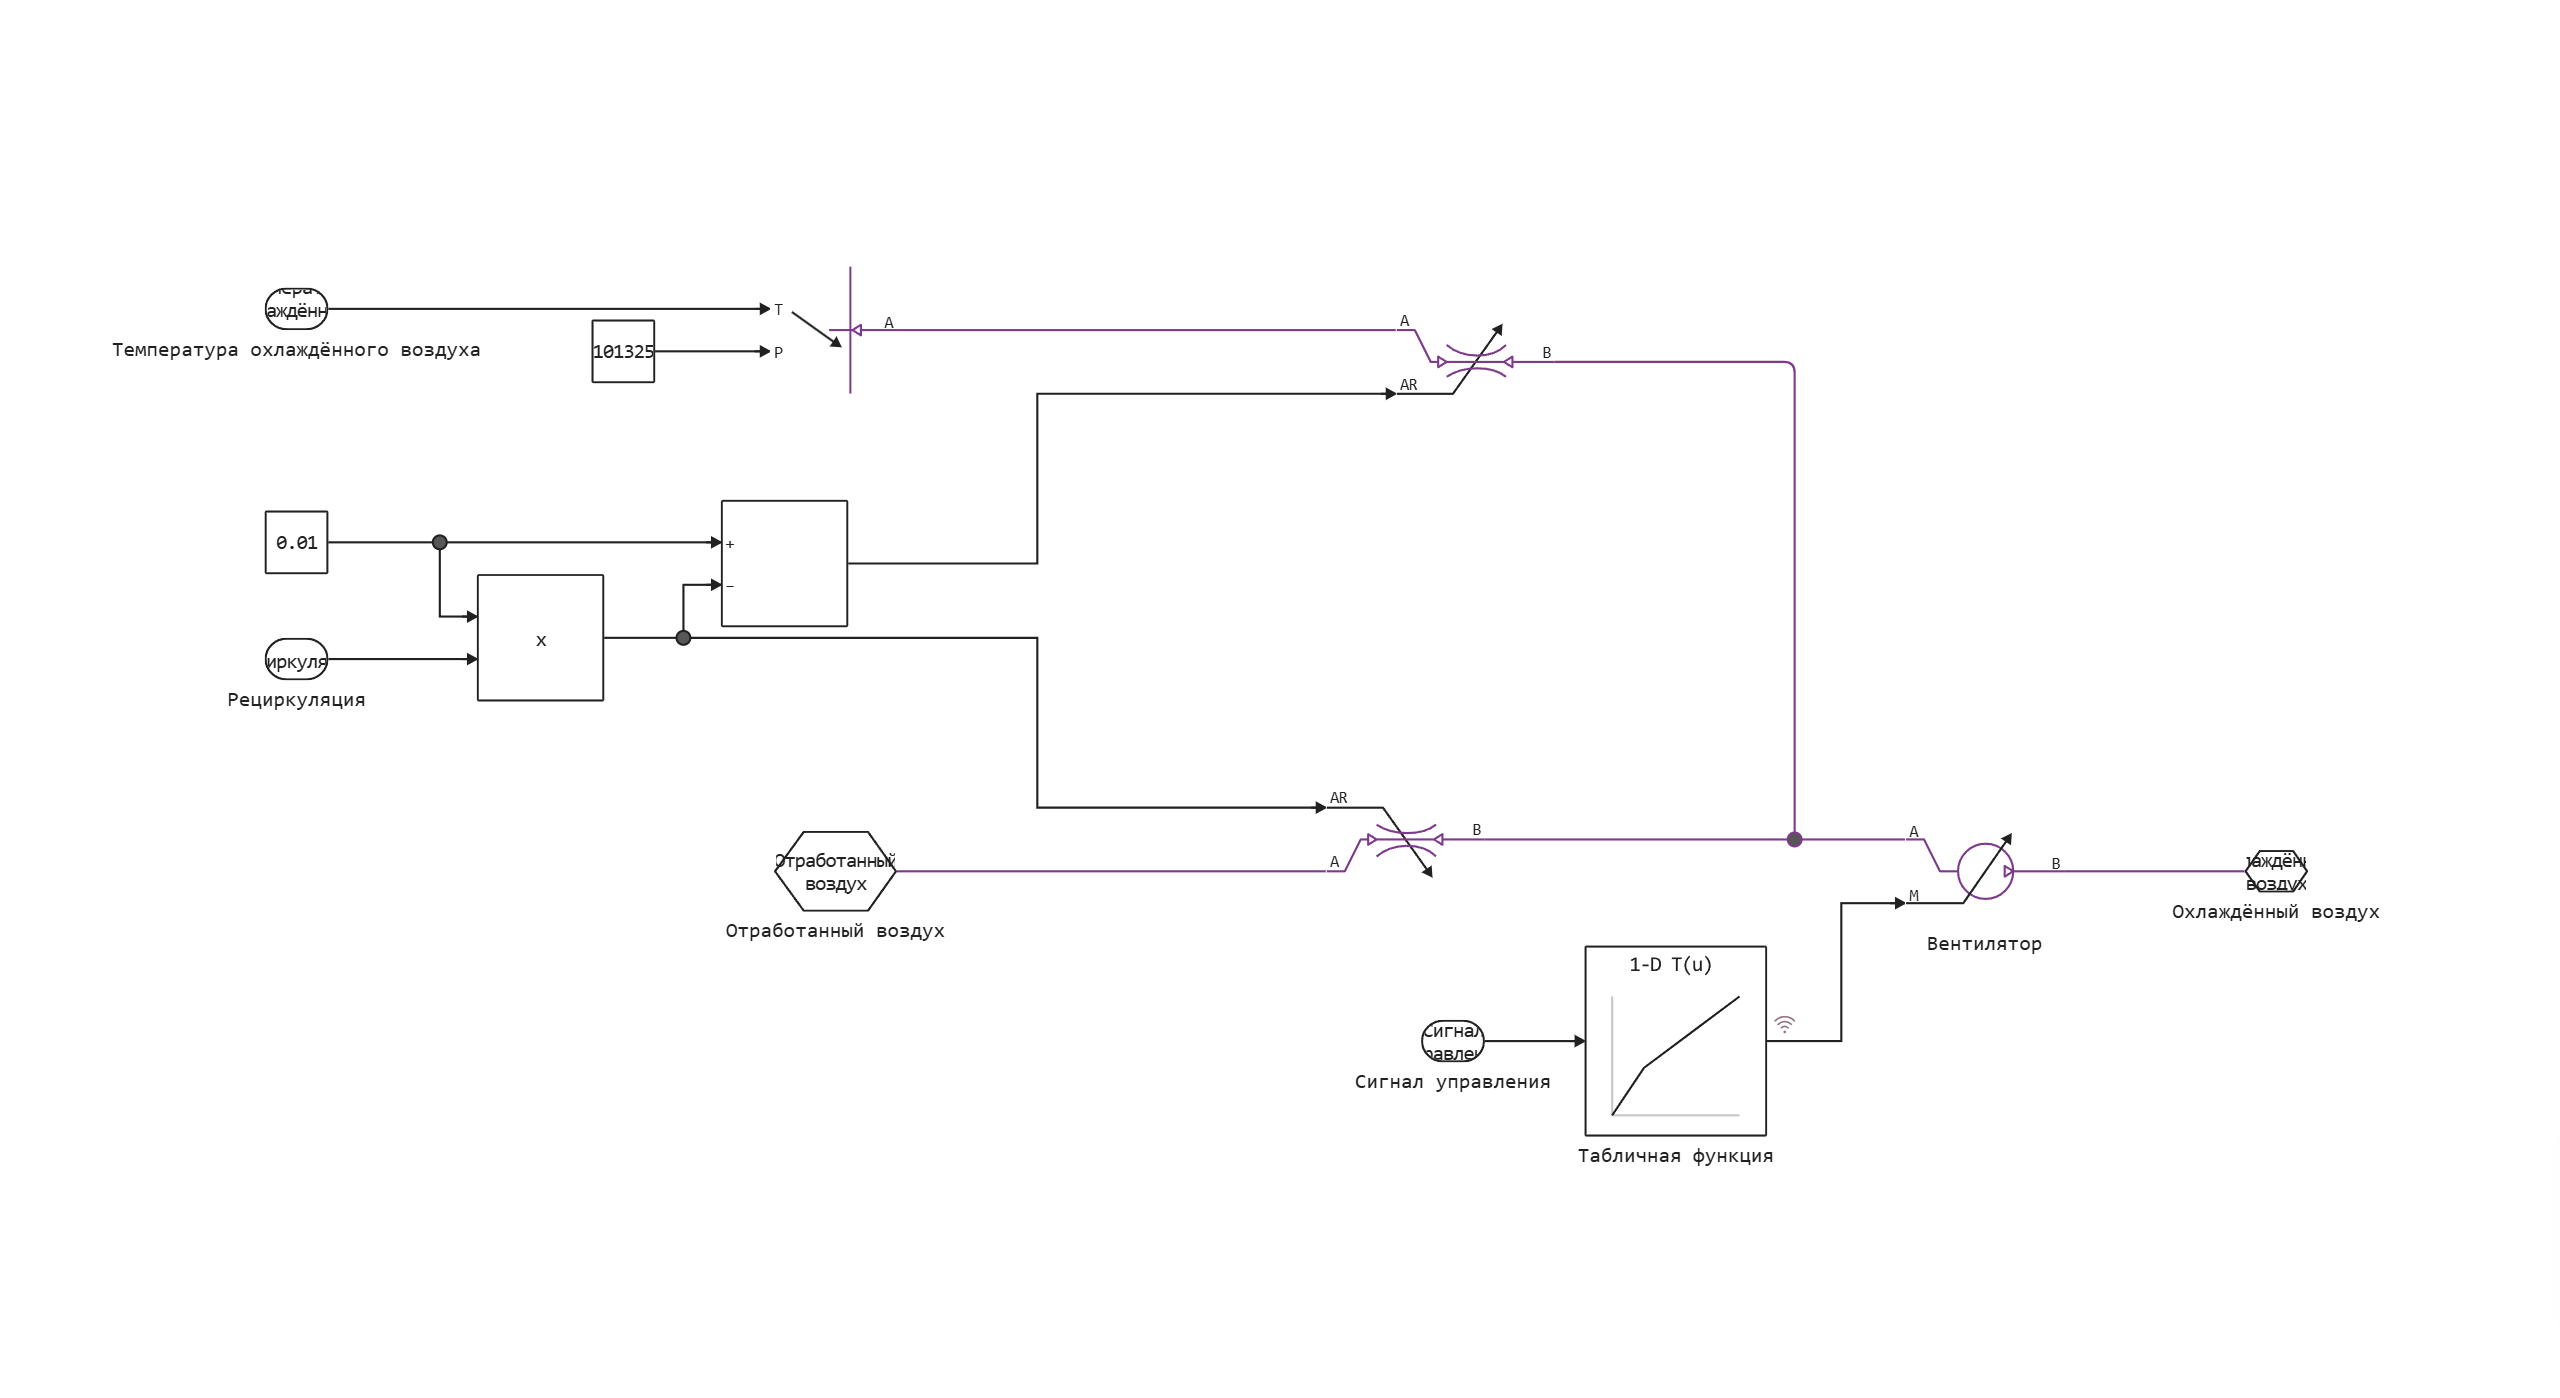
Subsystem "Ventilation system"
Subsystem "Heat exchange with the external environment"
Defining the function to load and run the model:
function start_model_engee()
    try
        engee.close("building_ventilation_control", force=true) # closing the model
        catch err # if there is no model to close and engee.close() is not executed, it will be loaded after catch.
            m = engee.load("$(@__DIR__)/building_ventilation_control.engee") # loading the model
        end;

    try
        engee.run(m) # launching the model
        catch err # if the model is not loaded and engee.run() is not executed, the bottom two lines after catch will be executed.
            m = engee.load("$(@__DIR__)/building_ventilation_control.engee") # loading the model
            engee.run(m) # launching the model
        end
end
Running the simulation
start_model_engee();
Extracting site temperature data from the simout variable and writing it to variables:
result = simout;
res = collect(result)
Recording signals from temperature sensors into variables:
T1 = collect(res[8])
T2 = collect(res[7])
T3 = collect(res[9])
T4 = collect(res[4])
T5 = collect(res[10])
T6 = collect(res[6])
door = collect(res[3])
recycling = collect(res[1]);
Visualization of simulation results
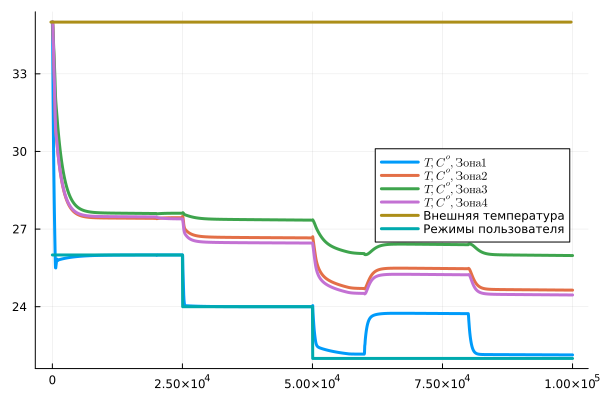
Temperature graph with zones, external temperature and user-adjustable temperature value:
using Plots
gr()
plot(T1[:,1], T1[:,2], label=L"T, C^o, Zone 1", linewidth=3)
plot!(T2[:,1], T2[:,2], label=L"T, C^o, Zone 2", linewidth=3)
plot!(T3[:,1], T3[:,2], label=L"T, C^o, Zone 3", linewidth=3)
plot!(T4[:,1], T4[:,2], label=L"T, C^o, Zone 4", linewidth=3)
plot!(T5[:,1] .- 273.15, T5[:,2] .- 273.15, label="External temperature", linewidth=3)
plot!(T6[:,1], T6[:,2], label="User Modes", linewidth=3, legend=:right)
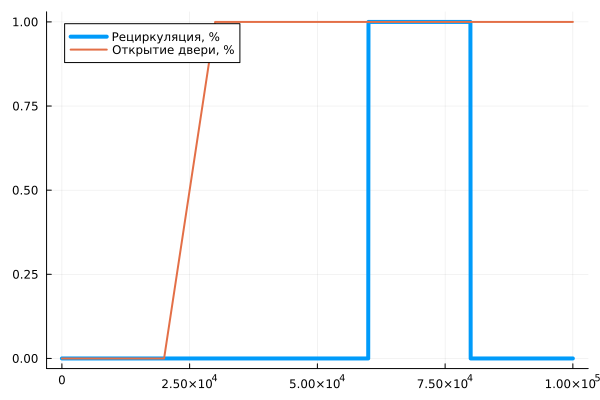
Factors affecting air circulation - door opening and forced recirculation:
plot(recycling[:,1], recycling[:,2] .* 2, linewidth=4, label="Recycling, %")
plot!(door[:,1], door[:,2] ./ 10000, linewidth=2, label="Opening the door, %")
Conclusion:
In this example, a simulation of a ventilation system in a building with an automatic air temperature control system was demonstrated. In the above simulation scenario, the system was influenced by opening the door (controlled narrowing) and the recirculation circuit (air duct). After analyzing the results, it can be seen that opening the door has no noticeable effect on the zonal temperature distribution, while recirculation seriously changes the picture of this distribution. The temperature regime set by the user is correctly observed for zone 1, but not in other zones, due to their distance from the ventilation system.