Aircraft pitch motion control
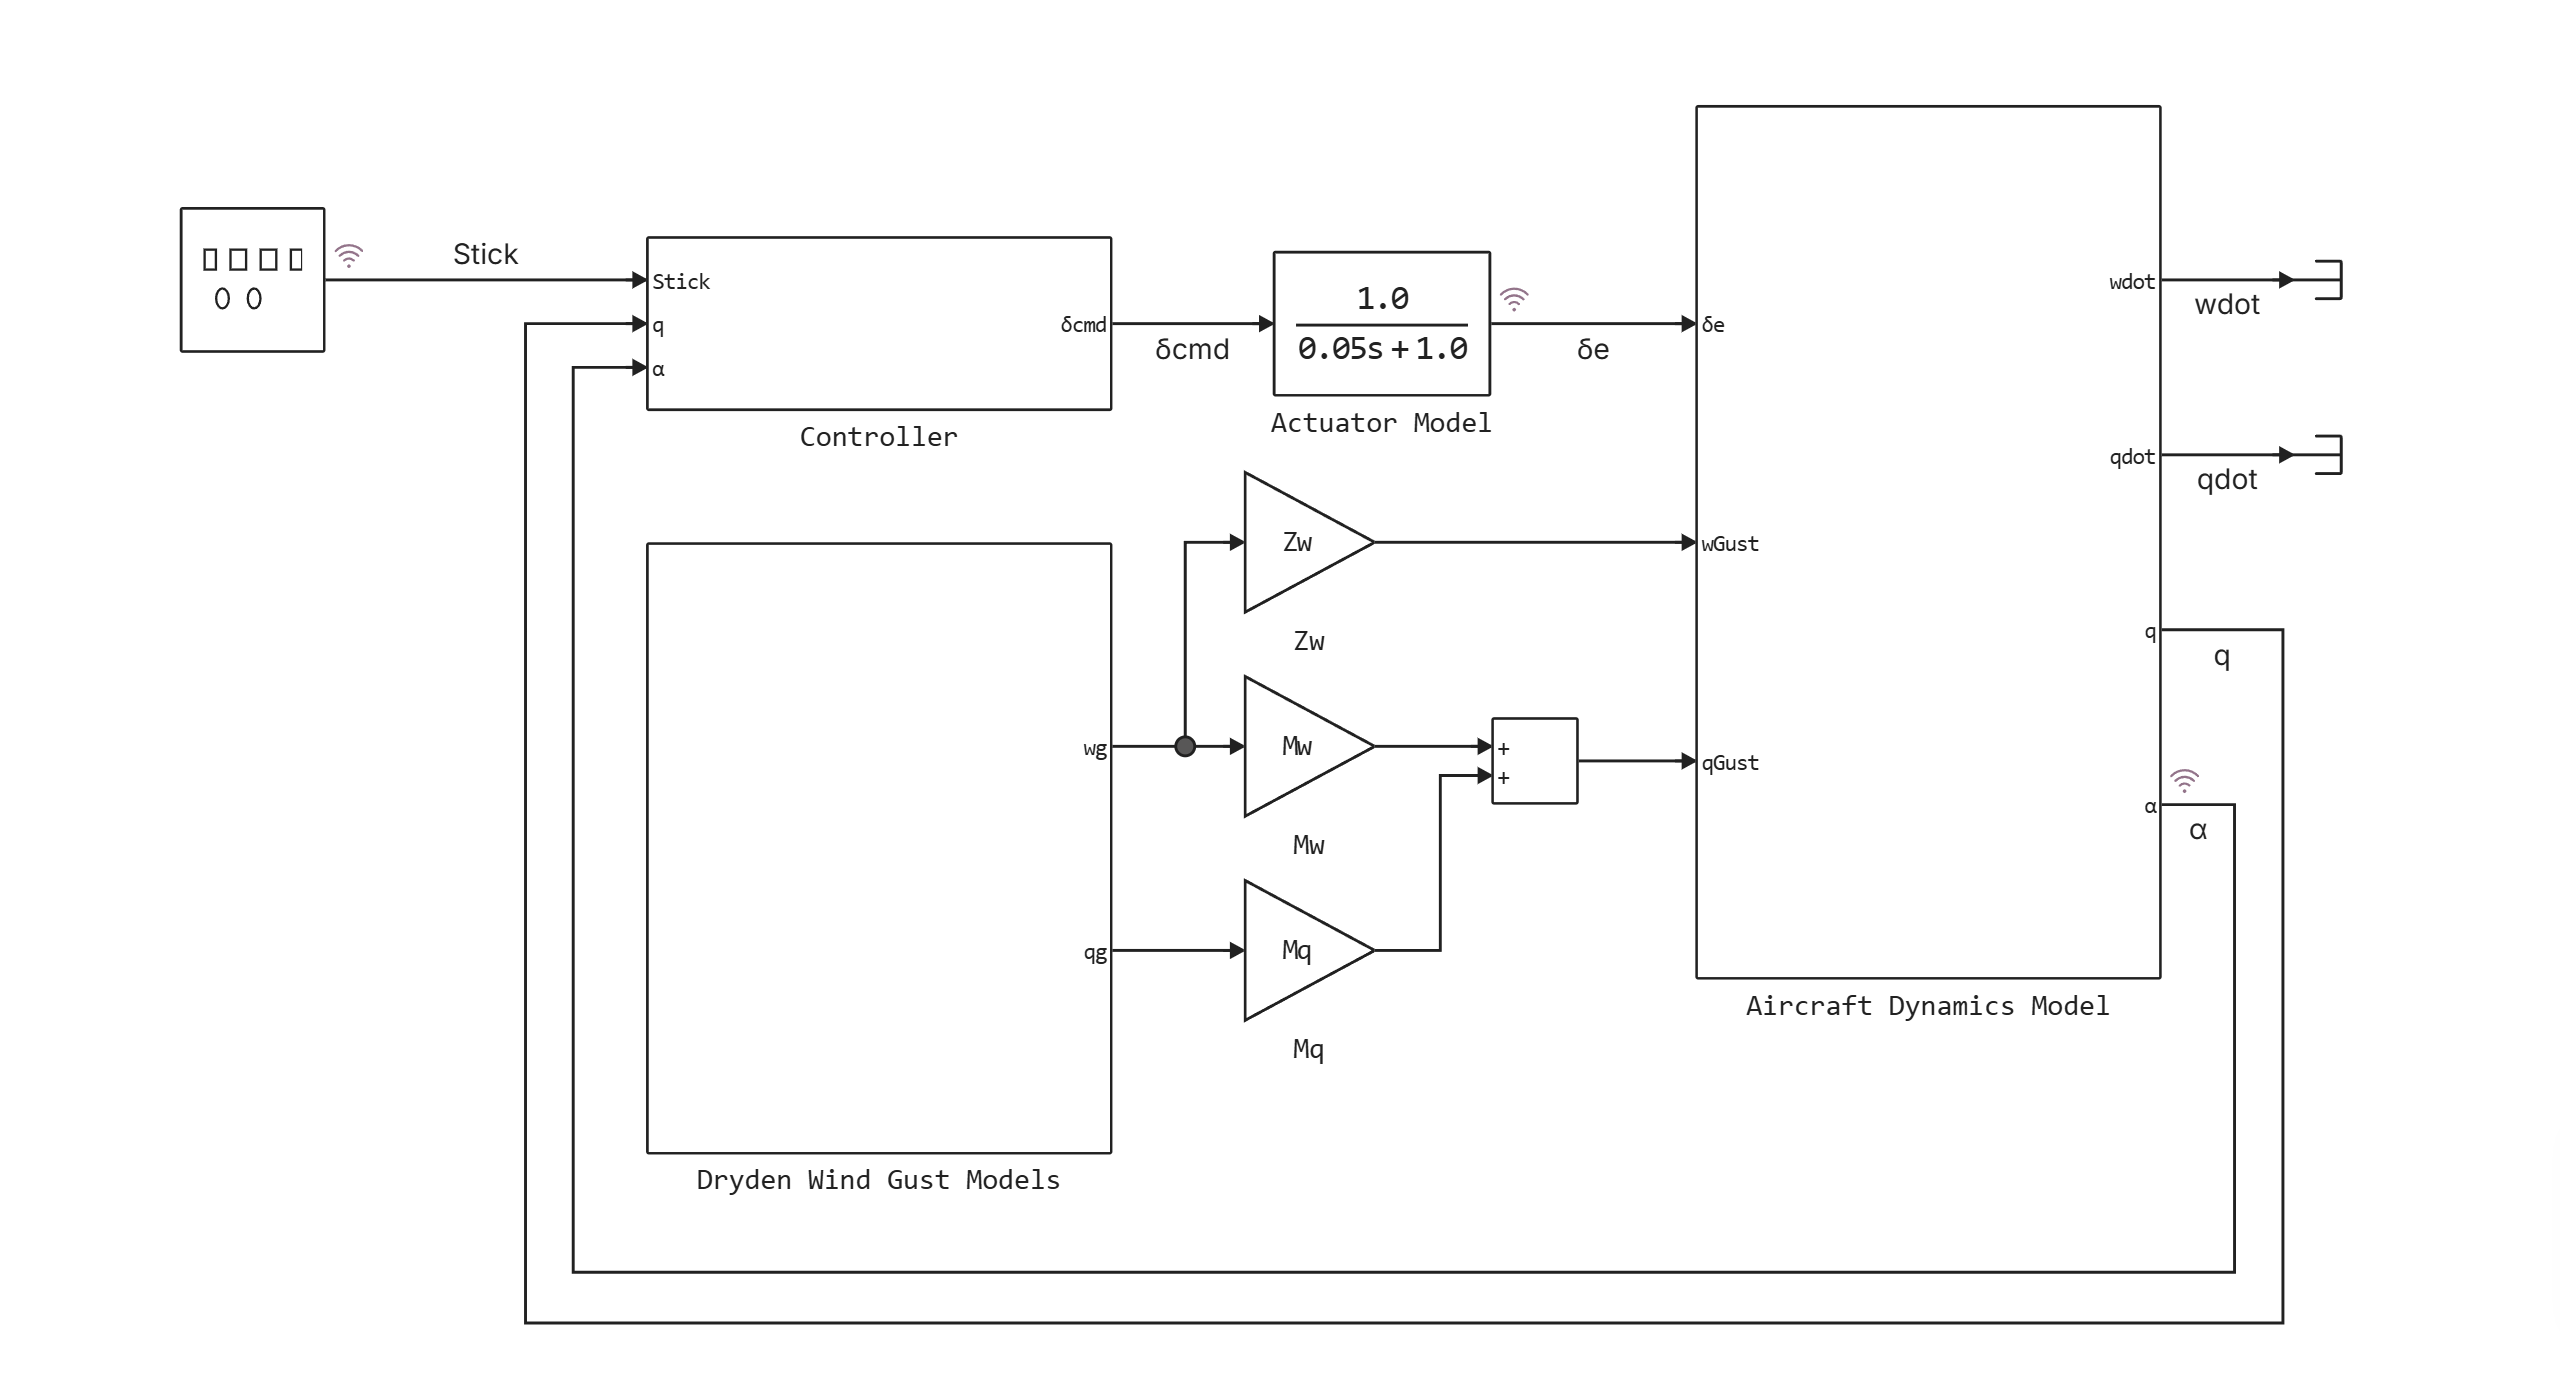
This example demonstrates the simulation of an aircraft's longitudinal motion control system. The models of aircraft dynamics and actuators are described by first-order linear approximations and connected to an analog control system. Subsystem Controller (Regulator):
-
Uses the pitch signal from the aircraft control stick as a setpoint for the pitch angle of the aircraft.
-
Uses the pitch angle of the aircraft and the rate of change of this angle to form control actions.
To perturb the system, a simplified subsystem Dryden Wind Gust Models (Dryden Gust Models) is implemented in the model.
Model diagram:
Defining the function to load and run the model:
In [ ]:
function start_model_engee()
    try
        engee.close("pitch_control", force=true) # closing the model
        catch err # if there is no model to close and engee.close() is not executed, it will be loaded after catch.
            m = engee.load("$(@__DIR__)/pitch_control.engee") # loading the model
        end;

    try
        engee.run(m) # launching the model
        catch err # if the model is not loaded and engee.run() is not executed, the bottom two lines after catch will be executed.
            m = engee.load("$(@__DIR__)/pitch_control.engee") # loading the model
            engee.run(m) # launching the model
        end
end
Out[0]:
Running the simulation
In [ ]:
start_model_engee();
Extraction of pitch angle and setpoint signals from the simout variable:
In [ ]:
result = simout;
res = collect(result)
Out[0]:
Writing signals to variables:
In [ ]:
alpha = collect(res[1])
stick = collect(res[2]);
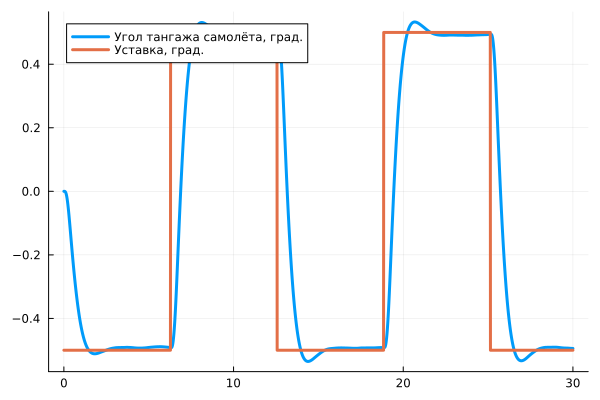
Visualization of simulation results
Aircraft pitch angle graph and setpoint signal:
In [ ]:
using Plots
gr()
plot(alpha[:,1], alpha[:,2], label="The pitch angle of the aircraft, degrees.", linewidth=3)
plot!(stick[:,1], stick[:,2], label="Setpoint, degree.", linewidth=3)
Out[0]: