Selecting a radio channel based on signal strength
In this example, let's look at how to divide an received broadband signal into several frequency bands in Engee. The model generates a mixture of three signals with noise. Using an object Channelizer The EngeeDSP libraries will evaluate the power in each band and select the band with the lowest energy.
The receiver needs to understand which parts of the spectrum are occupied by other transmitters. For an initial assessment, you can compare the average capacities in several bands. This assessment is useful when setting up a multi-channel receiver and investigating interference conditions.
The separation is performed by a polyphase filter bank: the common input passes through a set of filters, each of which allocates its own band. In Engee, this procedure is performed by a system object. EngeeDSP.Channelizer.
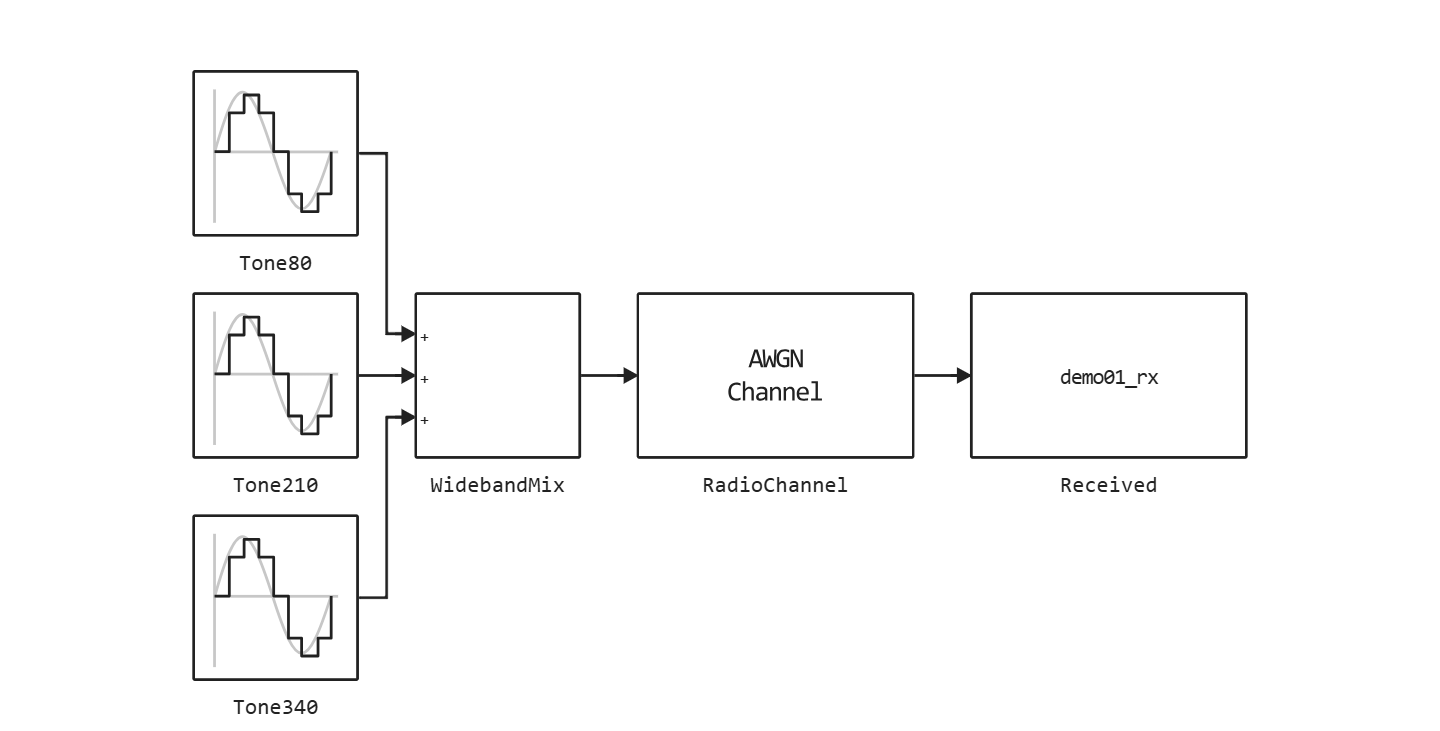
Diagram of the Engee model:
For the output signal power in the band let's estimate it using the formula
We will compare the bands after the initial transition process. For a real input, the positive and negative frequencies are connected by a complex conjugation. Therefore, the bank's output numbers cannot be directly interpreted as the numbers of eight independent positive radio channels.
In the model ChannelSelection.engee Three Sine Wave units form the 80, 210, and 340 Hz components. WidebandMix adds them up, RadioChannel adds white Gaussian noise. The signal rx It is saved by the To Workspace block.
The sampling rate is 1000 Hz. The sources are located inside the model: it is enough for the script to run it and process the received signal.
Connect the libraries and set the path to the model relative to the script folder. The auxiliary function will load and open the model, apply the parameters, and close it after startup. The data To Workspace is read from the Engee shared workspace, so we run this example programmatically with isolate = false.
using Statistics, DataFrames, Plots
gr()
name = "ChannelSelection"
path = joinpath(@__DIR__, name * ".engee")
@assert isfile(path) "Не найден файл модели: $path"
function load_and_run(path, name; settings=Pair{String,String}[])
    try engee.close(name; force=true) catch end
    model = engee.load(path; force=true)
    engee.open(name)
    for (block, keyvalue) in settings
        engee.set_param!("$name/$block", keyvalue)
    end
    try
        engee.run(model)
    finally
        engee.close(name; force=true)
    end
end
wa(name) = Core.eval(Main, :(collect($(Symbol(name)))))
Now let's run the model, divide the received signal into eight bands and calculate their average power. We will exclude the first two lines of the result from the evaluation in order to reduce the impact of filling the filter.
using EngeeDSP
load_and_run(path,name)
df = wa("rx")
t = Float64.(df.time); rx = Float64.(df.value)
bands = EngeeDSP.Channelizer(8)(rx)
@assert size(bands,2) == 8
power = vec(mean(abs2.(bands[3:end,:]),dims=1))
free_band = argmin(power)
Let's build a time graph of the received signal and a power diagram. The number of the band with the lowest power will also be displayed in the text result.
p1 = plot(t,rx,xlabel="Time, from",ylabel="The amplitude",title="The signal after AWGN",legend=false)
p2 = bar(1:8,power,xlabel="Subband number",ylabel="Average power",title="Spectrum occupancy",legend=false)
display(plot(p1,p2,layout=(2,1),size=(850,650)))
println("Minimum power in the band ",free_band,"; measurements: ",length(rx))
string("OK; полоса минимальной мощности=",free_band)
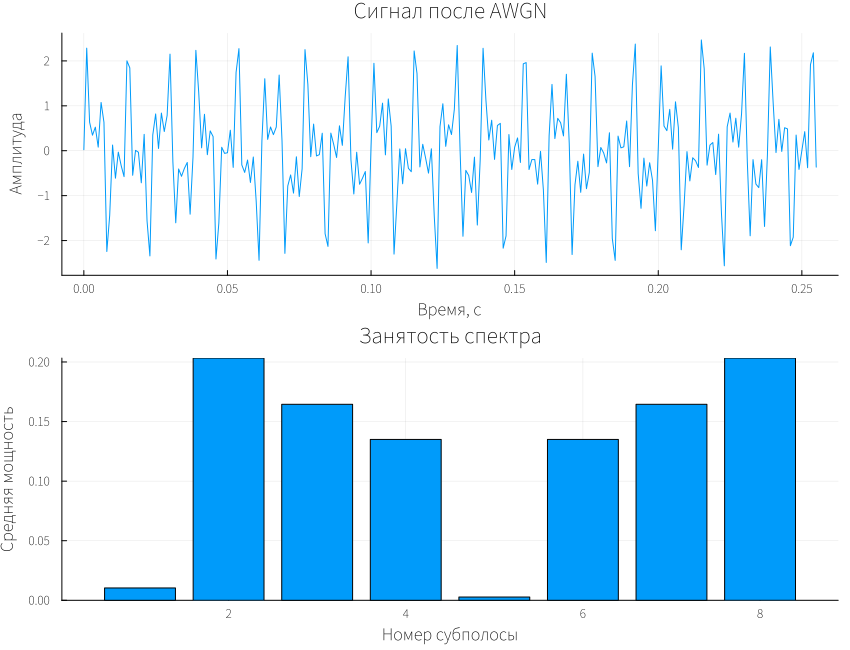
The first graph shows a composite signal with noise. The second stage compares the output capacities of the channel filter. The minimum column shows the least energetically loaded band in this experiment.
Low power alone does not prove that the radio channel is free. Such a solution requires a detection threshold, observation time, and verification of reception conditions. When the source frequencies are changed, the power distribution will change.
Conclusion
In this example, we looked at the collaboration of the model and the Engee script: the model generated a signal, and the object Channelizer divided it into strips. The resulting power estimate can be used as the basis for a spectrum occupancy study.