Suppression of narrowband interference in the BPSK signal
In this example, consider receiving a binary phase shift signal BPSK with strong narrowband interference. The Engee model generates bits, modulates them, and adds sinusoidal interference. Let's compare the signal and the fraction of error bits before and after the notch filter.
With BPSK, each bit is transmitted by one of two opposite phase states. In the selected display, bit 0 corresponds to the positive real part, and bit 1 corresponds to the negative part. Therefore, the solution can be obtained by the sign of the reference.
Strong sinusoidal interference changes this sign and causes errors. The notch filter attenuates a narrow part of the spectrum near the interference frequency. However, together with the interference, it can remove part of the useful signal — this limitation must also be taken into account.
The fraction of erroneous bits BER (bit error rate) is calculated as
The comparison will be carried out using the same sequence of bits. We will exclude the first 20 samples so that the initial state of the filter does not determine the result. Decisions here are made directly based on the counts; separate clock synchronization and a consistent filter are not modeled.
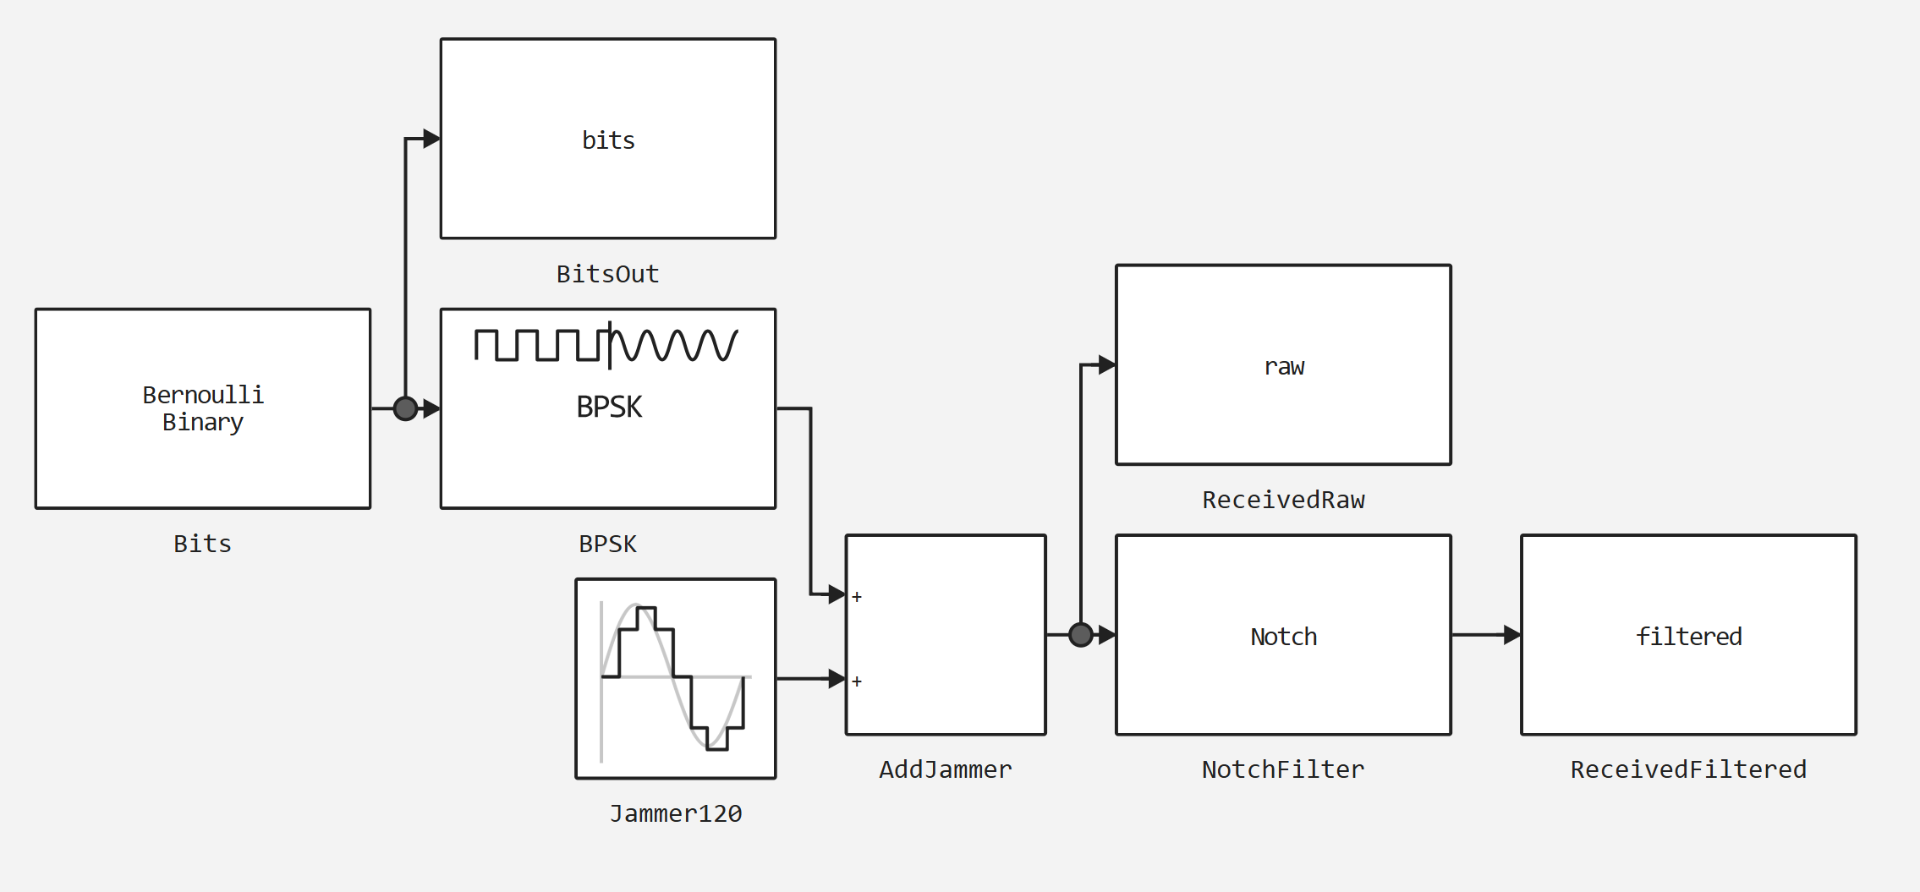
Model NotchJammer.engee contains a chain of blocks Bits → BPSK → AddJammer → NotchFilter (Bernoulli Binary Generator, BPSK Modulator Baseband, Add, Notch-Peak Filter). The interference has a frequency of 120 Hz. The notch output of the filter is used.
The source bits are written to the workspace bits, a signal with interference raw and the filtered signal filtered.
Connect the libraries and set the path to the model relative to the script folder. The auxiliary function will load and open the model, apply the parameters, and close it after startup. The data To Workspace is read from the Engee shared workspace, so we run this example programmatically with isolate = false.
using Statistics, DataFrames, Plots
gr()
name = "NotchJammer"
path = joinpath(@__DIR__, name * ".engee")
@assert isfile(path) "Не найден файл модели: $path"
function load_and_run(path, name; settings=Pair{String,String}[])
    try engee.close(name; force=true) catch end
    model = engee.load(path; force=true)
    engee.open(name)
    for (block, keyvalue) in settings
        engee.set_param!("$name/$block", keyvalue)
    end
    try
        engee.run(model)
    finally
        engee.close(name; force=true)
    end
end
wa(name) = Core.eval(Main, :(collect($(Symbol(name)))))
Let's run the model and read the three recorded signals. Let's compare the sign solutions with the original bits and find the BER in the same section of the record.
load_and_run(path,name)
bit_df = wa("bits"); raw_df = wa("raw"); filt_df = wa("filtered")
n = min(size(bit_df,1), size(raw_df,1), size(filt_df,1))
bits = Float64.(bit_df.value[1:n]) .> 0.5
raw = real.(raw_df.value[1:n])
filtered = real.(filt_df.value[1:n])
valid = 21:n
ber_raw = mean((raw[valid] .< 0) .!= bits[valid])
ber_filtered = mean((filtered[valid] .< 0) .!= bits[valid])
t = Float64.(raw_df.time[1:n])
Let's build fragments of the signals and compare the BER before and after the filter. This will allow you to simultaneously see the effect of the filter and evaluate the reception quality.
p1 = plot(t[1:100],raw[1:100],label="Before the filter",xlabel="Time, from",ylabel="The amplitude",title="BPSK and narrowband interference")
plot!(p1,t[1:100],filtered[1:100],label="After the filter")
p2 = bar(["До", "После"],[ber_raw,ber_filtered],ylabel="BER",title="The percentage of erroneous bits",legend=false)
display(plot(p1,p2,layout=(2,1),size=(850,650)))
println("BER before=",ber_raw,"; after=",ber_filtered,"; checked bit=",length(valid))
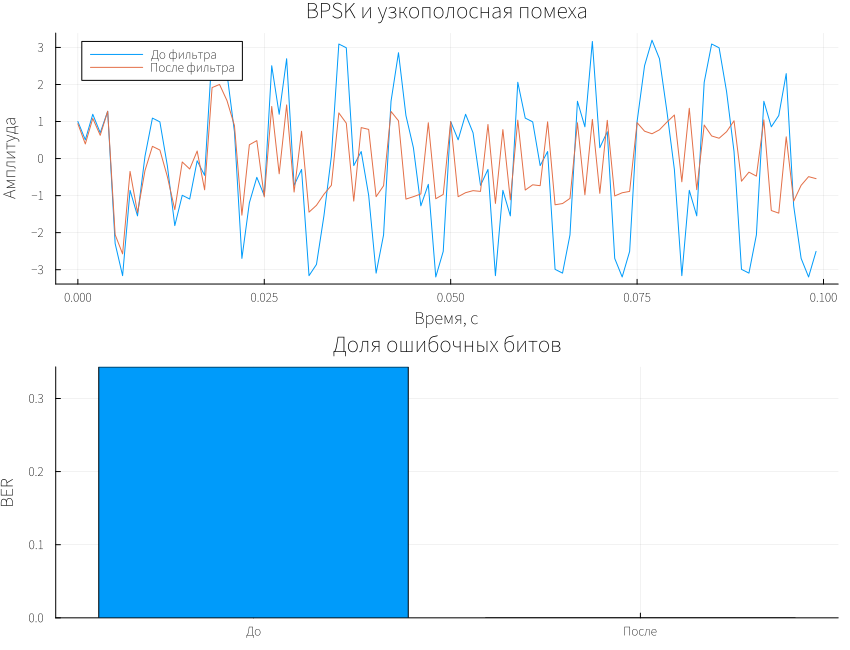
After the filter, the sinusoidal component should decrease. The BER columns show how much it helped to restore the bits for the selected frequency and amplitude of the interference.
The zero number of errors applies only to the investigated end record. It does not mean that there is zero chance of error under any conditions. If you shift the interference frequency or change the filter band, the effect needs to be measured again.
Conclusion
In this example, we have shown how to investigate interference suppression in Engee and test it using bit solutions. Notch filtering is useful when the frequency of narrowband interference is known. When choosing a cutting band, it is important to preserve the useful part of the spectrum.