DSB‑SC systems
As part of this example, an Engee simulation model was developed that implements two-band suppressed carrier modulation (DSB-SC, Double-Sideband Suppressed Carrier). The main purpose of the simulation is to visually demonstrate the DSB-SC signal generation process. Special attention is paid to the effect of the low-pass filter (low-pass filter) parameters in the demodulator path on the accuracy of signal reproduction.
Two—band suppressed carrier modulation is a type of analog amplitude modulation in which the carrier oscillation is completely suppressed, and only two side bands are transmitted, symmetrical with respect to the carrier frequency. Mathematically, a DSB-SC signal is described as the product of a modulating signal on a harmonic carrier:
This arrangement makes it possible to significantly increase the energy efficiency of the transmitter compared to classical AM: all power is spent on transmitting useful information, rather than on emitting a carrier oscillation that does not contain data. DSB-SC is widely used in stereo broadcasting systems, satellite and radio relay communications, as well as in measuring technology.
Demodulation of the DSB-SC signal is possible only by synchronous detection, which involves multiplying the received signal with a reference oscillation identical to the carrier in frequency and phase. As a result of multiplication, two components are formed:
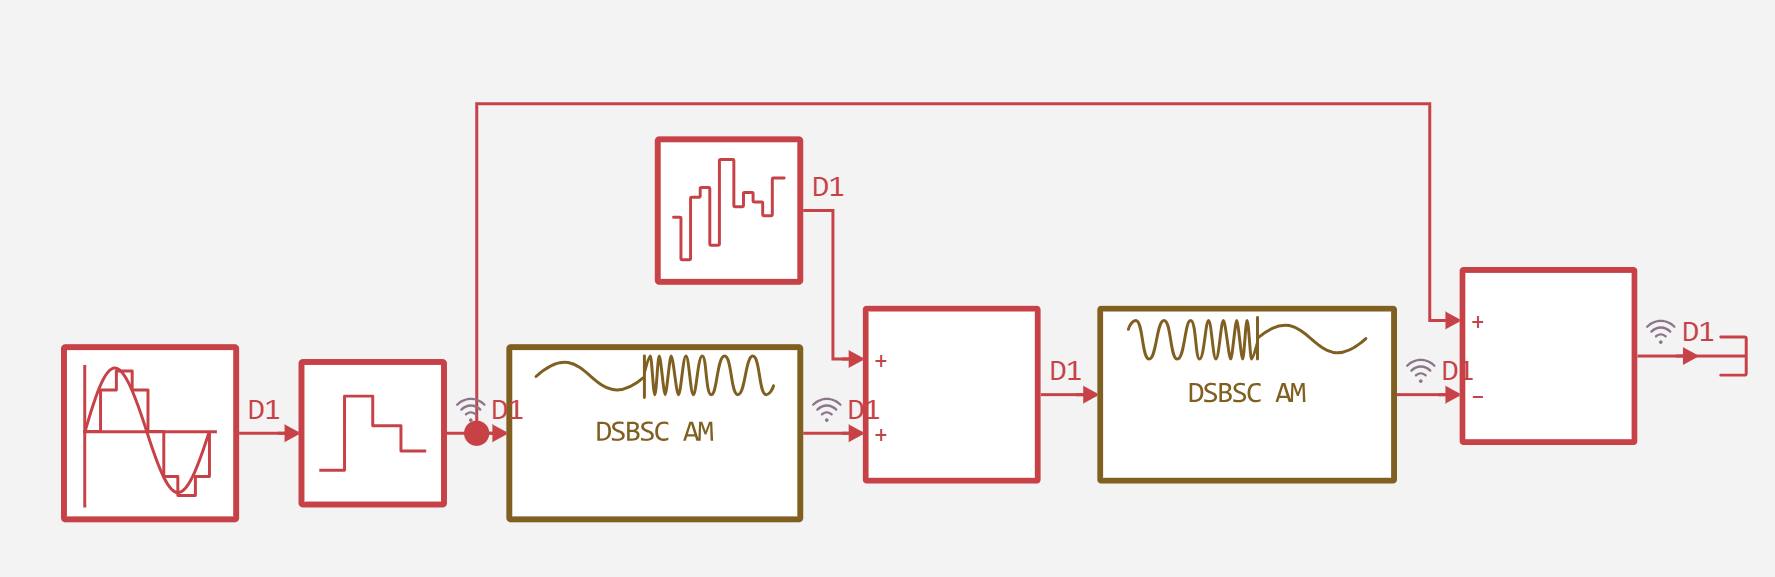
The model is built in the Engee environment and includes the following functional blocks:
- Sinusoidal signal generator — simulates the transmitted message.
- Zero-Order Hold — provides time quantization of the signal.
- DSBSC AM Modulator Passband — performs modulation by multiplying the input signal by a carrier oscillation with a frequency of 300 Hz and an initial phase of 0 rad.
- Adder and noise source — White Gaussian noise is added to the modulated signal to simulate the effects of a real transmission medium.
- DSBSC AM Demodulator Passband — performs synchronous detection (multiplication with a 300 Hz carrier) and subsequent filtering. Parameters of the built-in low-pass filter: Butterworth design method, order 8, cutoff frequency 40 Hz.
- Error calculation unit (adder) — calculates the difference between the initial discrete signal (from the Zero-Order Hold output) and the output of the demodulator.
function run_model( name_model)
    Path = (@__DIR__) * "/" * name_model * ".engee"
    if name_model in [m.name for m in engee.get_all_models()]
        model = engee.open( name_model )
        model_output = engee.run( model, verbose=true );
    else
        model = engee.load( Path, force=true )
        model_output = engee.run( model, verbose=true );
        engee.close( name_model, force=true );
    end
    sleep(0.1)
    return model_output
end
run_model("DSB-SC")
Input = collect(simout["DSB-SC/Zero-Order Hold.1"]).value
Modulator = collect(simout["DSB-SC/DSBSC AM Modulator Passband-1.1"]).value
Demodulator = collect(simout["DSB-SC/DSBSC AM Demodulator Passband.1"]).value
Error = collect(simout["DSB-SC/Add-1.1"]).value
t = collect(simout["DSB-SC/Add-1.1"]).time
gr(fmt=:png, size=(800, 400), titlefont=font(12), guidefont=font(10), legendfont=font(9))

p1 = plot(t, Input,
          label="The original signal",
          linewidth=1.5,
          color=:blue)
plot!(t, Demodulator,
      label="Demodulated signal",
      linewidth=1.5,
      color=:red,
      linestyle=:dash)
plot!(p1, title="Comparison of the original and demodulated signals",
          xlabel="Time, from",
          ylabel="The amplitude",
          legend=:topright)

p2 = plot(t, Error,
          label="Decoding error",
          linewidth=1.0,
          color=:black)
plot!(p2, title="Decoding error (signal difference)",
          xlabel="Time, from",
          ylabel="Error amplitude",
          legend=:topright)

p3 = plot(t, Modulator,
          label="Modulated Signal (DSB-SC)",
          linewidth=0.8,
          color=:green)

plot!(p3, title="The output signal of the DSB-SC modulator",
          xlabel="Time, from",
          ylabel="The amplitude",
          legend=:topright)

final_plot = plot(p1, p2, p3, layout=(3, 1), size=(800, 1000))
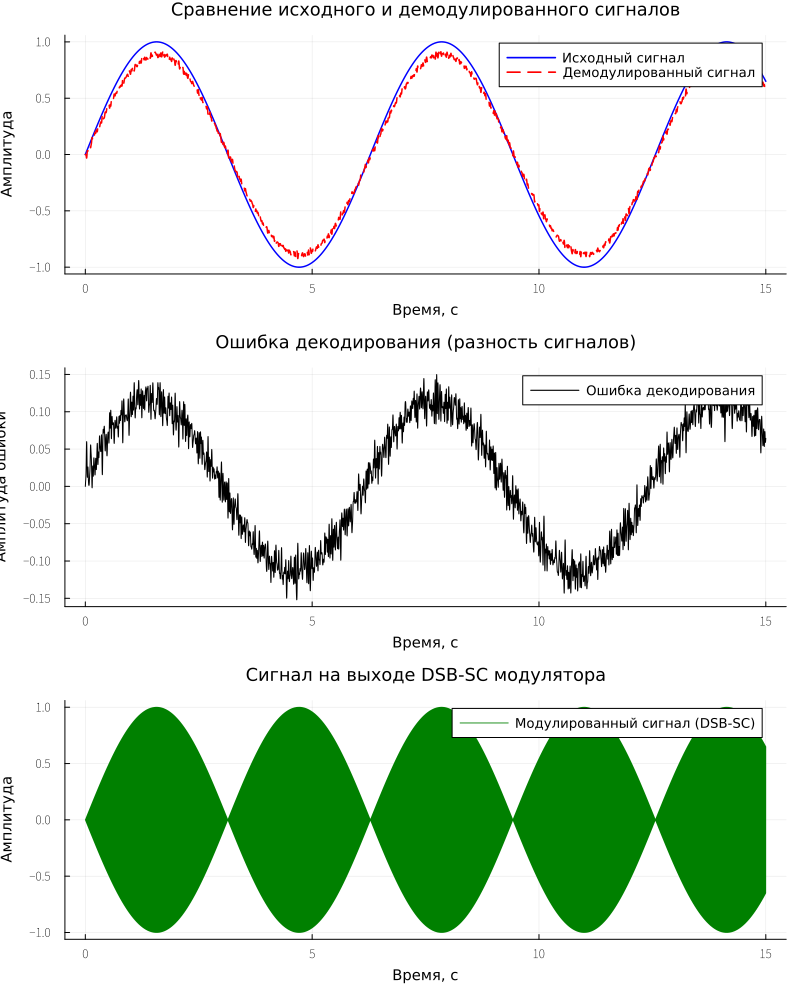
The analysis of the plotted graphs revealed the following effects:
- The first graph ("Comparison of the original and demodulated signals") shows that the original signal is a pure sine wave with a frequency of 1 Hz. The demodulated signal as a whole exactly repeats the shape of the original message, however, the presence of high-frequency pulsations (about 600 Hz) superimposed on the main sinusoid is observed.
- In the second graph ("Decoding error") It is clearly seen that the signal difference also contains high-frequency ripples and does not tend to absolute zero, which indicates the presence of residual distortions.
Thus, the overall envelope of the signal is preserved, but the presence of spurious oscillations prevents the achievement of zero error. This is due to a combination of the following factors:
- Phase distortion and group delay of the filter.
- Filter transients.
Conclusion
The developed simulation model successfully demonstrates the physical principles of DSB-SC modulation and synchronous detection. It has been experimentally confirmed that the quality of signal recovery critically depends on the parameters of the low-pass filter in the demodulator. The results clearly illustrate an engineering compromise in the design of real communication systems: a balance between the complexity of the filter, its phase distortion and the required quality of demodulation.