Determination of the frequency response of the system
In this example, we will analyze the use of spectral analysis to determine the frequency response of an unknown discrete system.
The easiest way is
to apply a flat spectrum signal to the input. The spectrum of the output signal in this case will
be the frequency response of the system.
There are two ways to get a flat-spectrum signal: use white noise or a pulse signal.
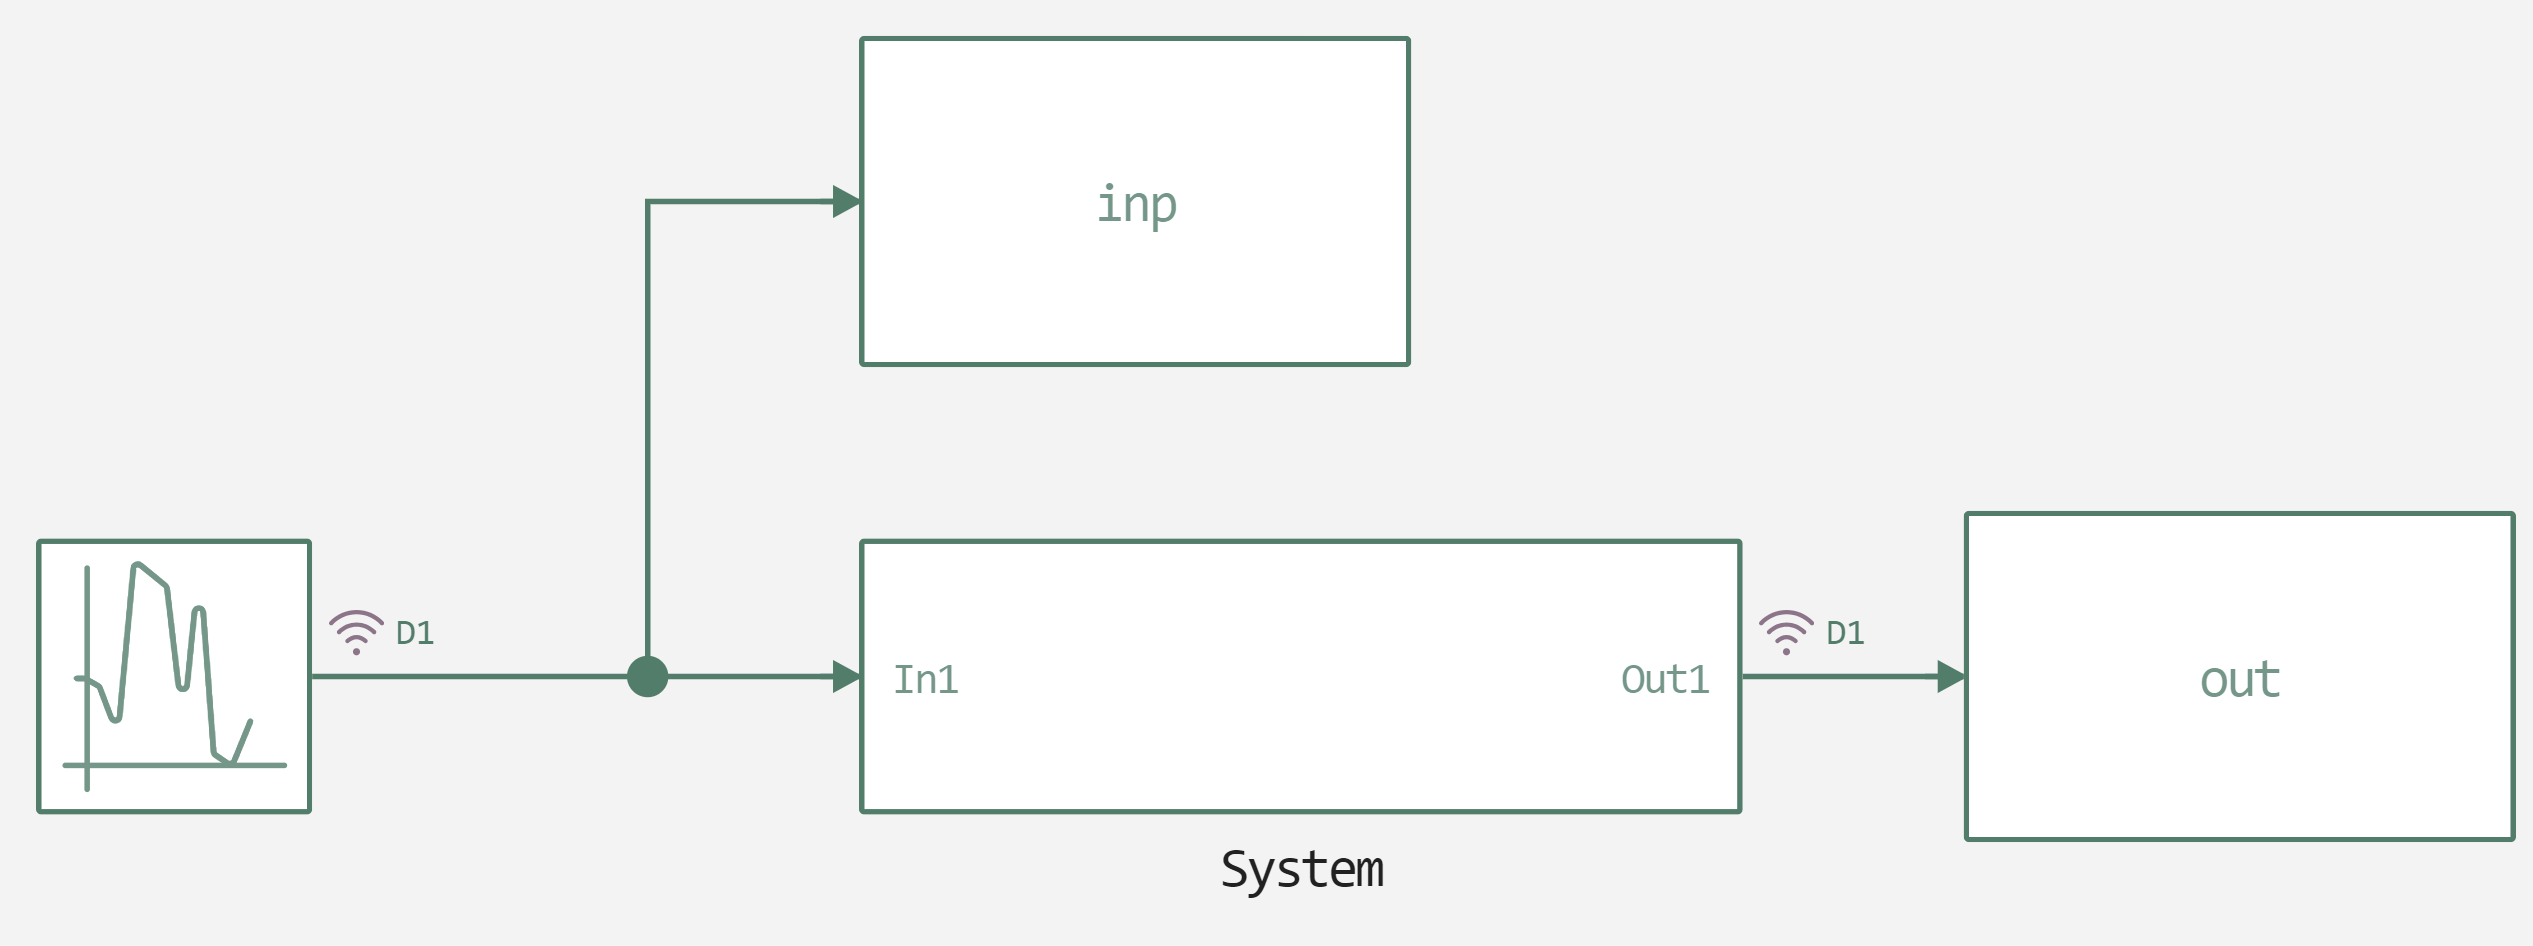
In this example, a random source is used to generate white noise. The pictures below show our model.
The top level of the model.
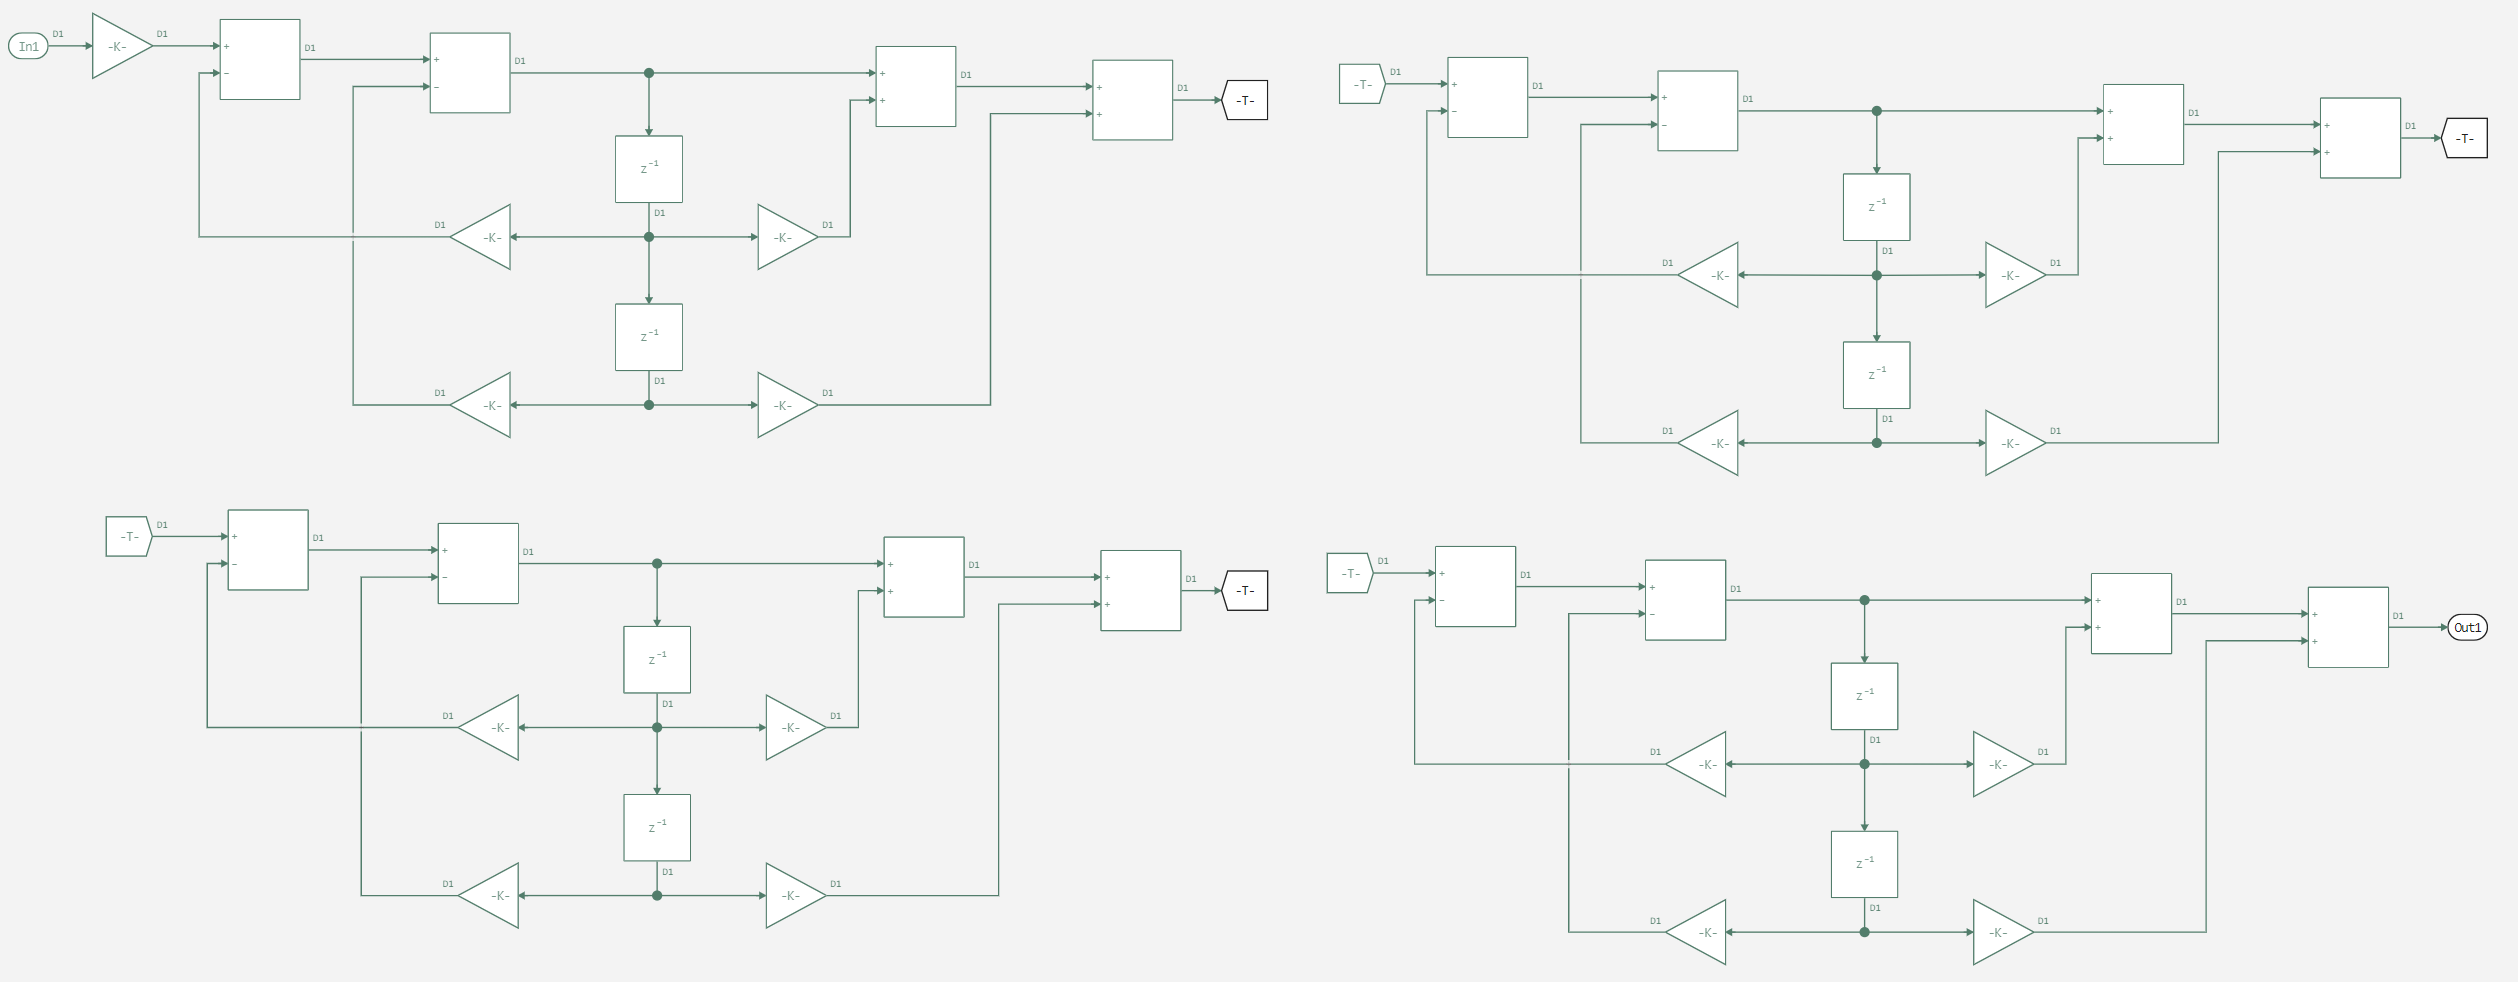
A subsystem with unknown characteristics.
Next, we will declare an auxiliary function for launching the model.
# Enabling the auxiliary model launch function.
function run_model( name_model)

    Path = (@__DIR__) * "/" * name_model * ".engee"

    if name_model in [m.name for m in engee.get_all_models()] # Checking the condition for loading a model into the kernel
        model = engee.open( name_model ) # Open the model
        model_output = engee.run( model, verbose=true ); # Launch the model
    else
        model = engee.load( Path, force=true ) # Upload a model
        model_output = engee.run( model, verbose=true ); # Launch the model
        engee.close( name_model, force=true ); # Close the model
    end
    sleep(5)
    return model_output
end
Let's run the model and analyze the recorded data.
run_model("freqrespLTI") # Launching the model.

inp = collect(inp);
inp = inp.value;
out = collect(out);
out = out.value;
Let's construct a spectrum for the input and output values.
using FFTW
fs = 100
gr()
plot(fftfreq(length(inp[1:2000]), fs), abs.(fft(inp[1:2000])./length(inp[1:2000])),
        xguide="Frequency  / Hz", yguide="Magnitude")
plot!(fftfreq(length(out[1:2000]), fs), abs.(fft(out[1:2000])./length(out[1:2000])),
        xguide="Frequency  / Hz", yguide="Magnitude")
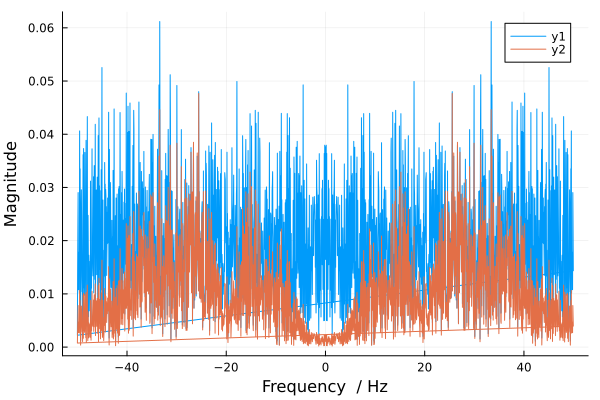
Conclusion
We have made sure that there are obvious frequency regions in the output signal that are suppressed by our system. Based on these data, we can determine in detail the frequency response of the system.