AC Voltage Voltmeter
In this example, we will show how to make a voltmeter model for measuring alternating voltage from an instantaneous voltage sensor.
Description of the model
Standard AC voltmeters can rely on a wide variety of principles to convert an instantaneous (AC) signal into a stable indicator.
Most often, as the output value of such a voltmeter, when a sine wave is applied at the input, it is expected to receive an effective signal value equal to (where – the amplitude of the sine wave). When measuring a different waveform, correction factors must be entered.
Let's assume that we have a voltmeter in front of us, the readings of which are proportional to the amplitude of the input signal (this is not always the case, sometimes the readings are proportional to its power). Voltage Generator ControlledVoltage receives some variable control signal, and the sensor Voltage returns us the instantaneous value measured at the time points set by the model's step settings.
The model takes a variable-form signal (by default, sinusoidal) at the input, multiplied by a step signal that determines its amplitude. The step instantly increases the amplitude of the signal generator from 1 to 5 V.
.png)
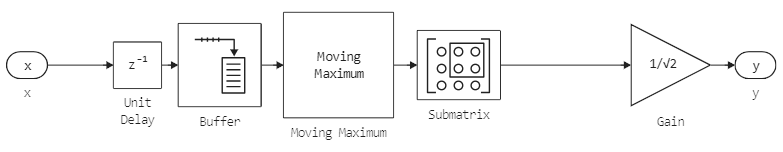
Block Цифровой вольтметр It is also represented by a masked subsystem. In its settings, you can specify the size of the smoothing window, which will affect the smoothness of changing the voltmeter readings.
.png)
The device of this voltmeter, simply put, provides for finding the amplitude of the signal and displaying a value equal to the amplitude divided by .
Launching the model
Before launching the model, we specifically set the generator to sinusoidal mode, referring to one of the components inside the unit. Генератор сигналов.
# If the model is not open yet, we will upload it from the file
if "ac_voltmeter_simple" ∉ getfield.(engee.get_all_models(), :name)
    engee.load( "$(@__DIR__)/ac_voltmeter_simple.engee");
end;

engee.set_param!( "ac_voltmeter_simple/Генератор сигналов/Signal Generator", "WaveForm"=>"sine" )
data = engee.run( "ac_voltmeter_simple" )
plot(
    plot( data["u"].time, data["u"].value, label="Instantaneous signal values" ),
    plot( data["y"].time, data["y"].value, label="Voltmeter readings" ),
    layout  = (2,1)
)
As we can see, when measuring a sine wave with an amplitude of 1, the voltmeter returned a value approximately equal to 0.707 or .
Let's see what happens if we apply a sawtooth value to the input of the circuit (sawtooth) or rectangular pulses (square).
engee.set_param!( "ac_voltmeter_simple/Генератор сигналов/Signal Generator", "WaveForm"=>"sawtooth" )
data = engee.run( "ac_voltmeter_simple" )
plot(
    plot( data["u"].time, data["u"].value, label="Instantaneous signal values" ),
    plot( data["y"].time, data["y"].value, label="Voltmeter readings" ),
    layout  = (2,1)
)
The effective value of the sawtooth signal is , that is , a sawtooth signal with an amplitude of 1 has an effective value 0.578.
But on the graph we see that the voltmeter still returns to us 0.707. This value is due to its principle of operation, which causes a methodological error in the measurements.
Knowing the shape of the input signal, it is easy to compensate for the effect of this error by multiplying it by the appropriate coefficient.
Conclusion
If desired, you can create a voltmeter model in Engee with accuracy up to the inertia of the arrow or segment indicators. Separately implement a rectifier, a DC device and other elements.
But if the purpose of the simulation is to demonstrate well-known methodological errors, they can be introduced using the blocks of the basic library, which we did.