We study cyclic data using FFT (FFT)
In this demonstration, we will analyze the data chronicling the number of spots on the surface of the Sun and identify the cyclic components using the fast Fourier transform algorithm.
Introduction
The Fourier transform allows us to analyze the nature of data changes, and of course, they were primarily used to analyze physical and natural processes.
The data that we will consider is a collection of almost 300 years of observational history. In the table sunspot The measurements made by astronomers who monitored the number and size of spots on the surface of the Sun are collected.
Data exploration
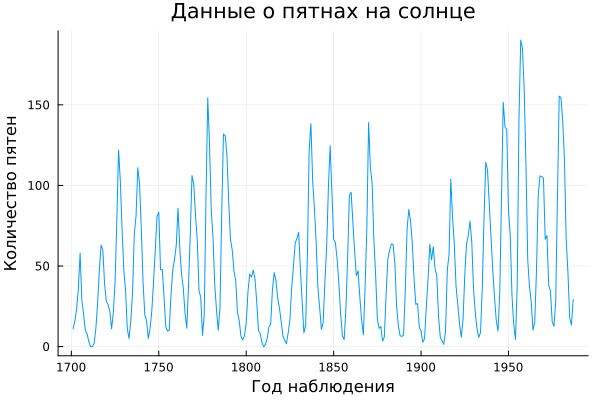
Let's download the necessary libraries, and then we'll display a graph showing the number of spots on the surface of the Sun recorded between 1700 and 2000.
Pkg.add(["CSV"])
using CSV, DataFrames
gr()

sunspot = CSV.read("sunspot.csv", DataFrame)
year = sunspot[:,1];
relNums = sunspot[:,2];
plot( year, relNums, xlabel="Year of observation",
    ylabel="Number of spots", title="Sunspot data", leg=false )
Let's approximate the graph and try to study the cyclical nature of sunspot appearances more thoroughly. To do this, we will plot a graph for the first 50 years of observations.
plot( year[1:50], relNums[1:50], c=1, marker=(:circle,3),
    leg=false, xlabel="Year of observation", ylabel="Number of spots" )
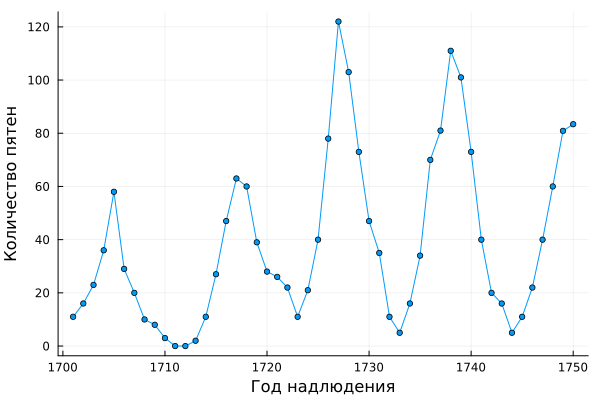
As we can see, the number of spots is noticeably changing, but we can assume that there is a periodic component in the data, because the peaks on the graph are located with an interval of about 10-15 years.
The Fourier transform
The Fourier transform is often a basic tool in signal processing. It allows you to identify harmonic components in the data (oscillatory processes). Using the function fft from a pre-installed library FFTW We are converting sunspot data from a time domain to a frequency domain.
From the resulting vector of values, you need to delete the first element that stores the sum of the data. Plot the rest of the resulting vector. It contains the real (Re) and imaginary (Im) parts of the complex coefficients of the Fourier transform.
using FFTW

y = fft( relNums )
y[1] = NaN
scatter( y, marker=(:o, 4, :white), markerstrokecolor=:red,
    xlabel="Re(y)", ylabel="Im(y)", title="Fourier coefficients", leg=false )
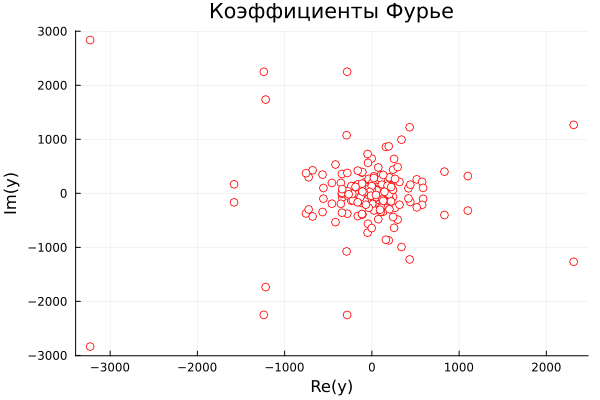
Fourier coefficients are difficult to interpret directly. A more informative indicator of the contribution of a coefficient to the process is the square of their amplitude, which can be interpreted as the power of the signal. Since each value occurs twice in the vector of power values of each component (for the positive and negative frequency scales), we need to calculate the power of either of the two halves of the vector of coefficients. Let's plot the power spectrum of components of different frequencies, showing the number of cycles observed over 1 year.
N = length(y);

power = abs.( y[1:Int32(floor(N/2))] ).^2; # power of first half of transform data
maxfreq = 1/2;                      # maximum frequency
freq = (1:N/2)/(N/2)*maxfreq;       # equally spaced frequency grid

plot( freq, power, xlabel="Cycle frequency (number per year)", ylabel="Power", leg=false )
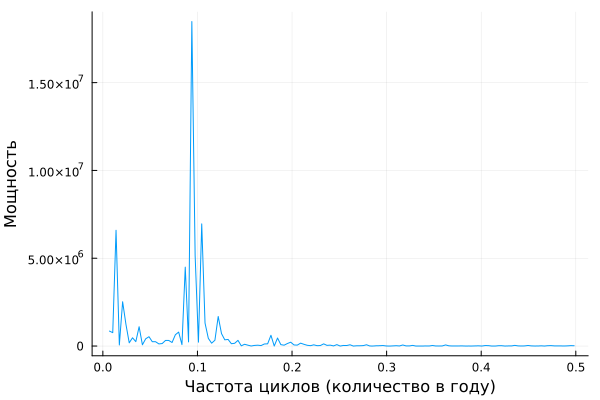
Recall that peaks in the graph of the number of spots are observed much less frequently than once a year. To make the graph easier to read, we will plot it depending on the period of the harmonic component (cycle length in years).
The graph shows that the most noticeable oscillatory process, expressed in a change in the number of sunspots, repeats approximately once every 11 years.
period = 1 ./ freq;
plot( period, power, xlimits=(0,50), xlabel="Cycle length (years)", ylabel="Power", leg=false )
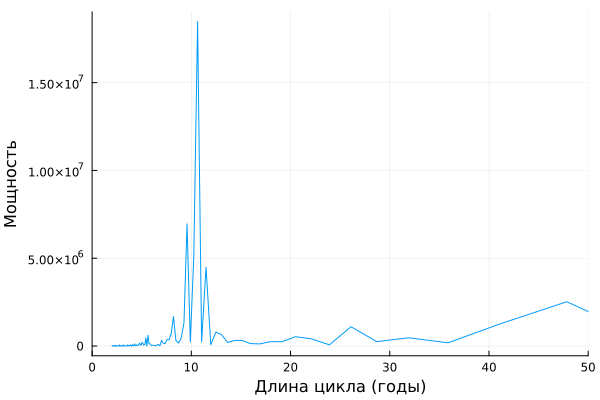
This is especially noticeable after building an approximate graph, in which we were able to see the most powerful components of the signal more closely.
Conclusion
We have studied the most common and simplest application scenario of the fast Fourier transform (FFT) through the function fft libraries FFTW to search for harmonic components of a signal, that is, to search for repetitive, cyclic processes in the signal and determine their power in the overall signal.