Simple multichannel filter¶ In this example we will study the possibilities of filtering frames in multichannel mode on the example of a simple FIR filter.
The figure below shows the model that we are studying
in this demonstration.
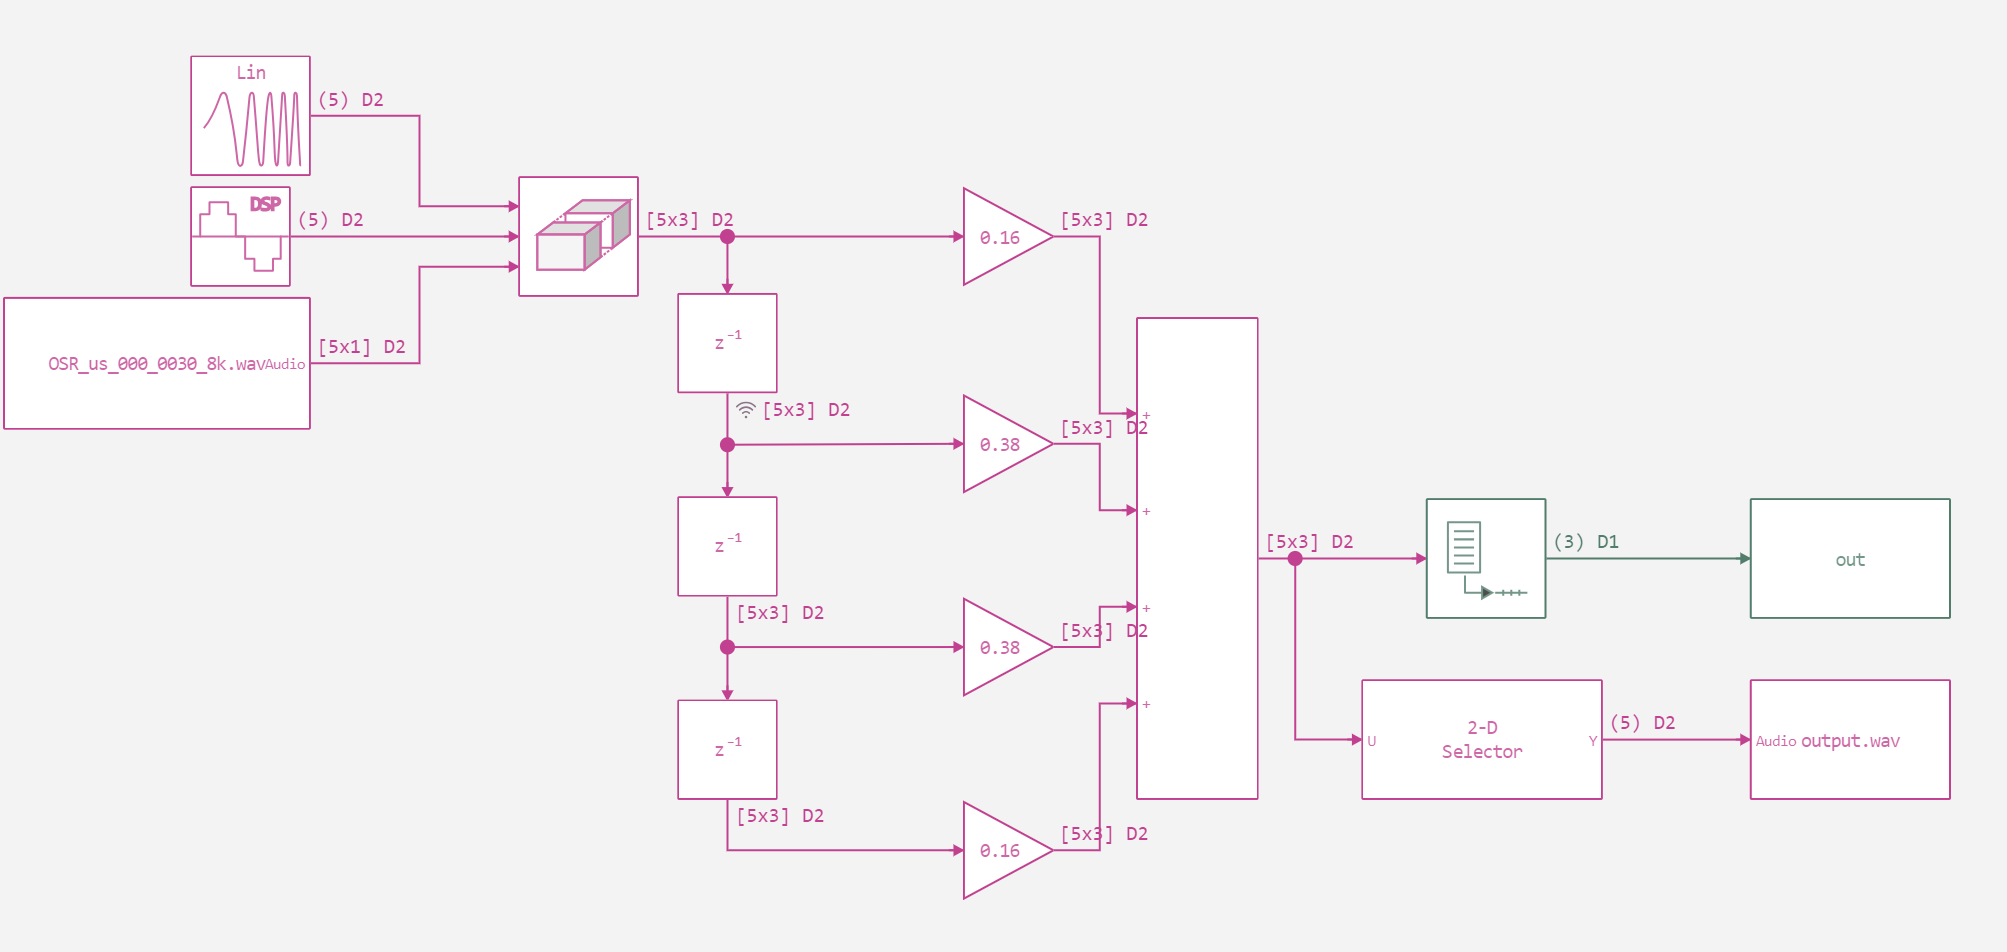
In this model, three different types of signals are input, and then each of them is passed through a filter. At the output we can analyse all signals together or each signal separately.
Before we start analysing the model, we set two auxiliary functions - the model run function and the audio player function.
Out[0]:
run_model (generic function with 1 method)
Out[0]:
audioplayer (generic function with 1 method)
Now let's run the model and analyse the obtained results.
Building...
Progress 0%
Progress 5%
Progress 10%
Progress 15%
Progress 20%
Progress 25%
Progress 30%
Progress 35%
Progress 40%
Progress 45%
Progress 50%
Progress 55%
Progress 60%
Progress 65%
Progress 70%
Progress 75%
Progress 80%
Progress 85%
Progress 90%
Progress 95%
Progress 100%
Progress 100%
Let's plot the display of all three channels of the system output.
In the graph, the three signals have completely different character and we can easily distinguish them from each other.
Now let's analyse two audio tracks - the original one and the one recorded from the model.
Your browser does not support the audio element.
On the recording you can hear that after filtering the audio track does contain less extraneous noise.
Conclusion¶ We have explored the possibilities of multichannel data processing. This approach is often found in communication systems and is very much in demand by developers.
{"id": "319ba57c-d2d7-41bf-a765-998bf4183c29", "data": [{"xaxis": "x", "mode": "lines", "x": [1, 2, 3, 4, 5, 6, 7, 8, 9, 10, 11, 12, 13, 14, 15, 16, 17, 18, 19, 20, 21, 22, 23, 24, 25, 26, 27, 28, 29, 30, 31, 32, 33, 34, 35, 36, 37, 38, 39, 40, 41, 42, 43, 44, 45, 46, 47, 48, 49, 50], "showlegend": true, "name": "Chirp", "colorbar": {"title": {"text": ""}}, "zmin": null, "z": null, "legendgroup": "Chirp", "y": [0.16, 0.15999504058040587, 0.15998006381559982, 0.15995492187849006, 0.15991946687639802, 0.5398735508830451, 0.5398052473496588, 0.5397023958080032, 0.5395644973401468, 0.5393910529733221, 0.9191815637911894, 0.9189237524257914, 0.9186051078430102, 0.9182247808963482, 0.9177819228073905, 1.077275685364269, 1.0767002617043648, 1.0760497474340138, 1.0753231494430562, 1.0745194759545909, 1.0736377367747163, 1.0726769435468178, 1.0716361100104197, 1.0705142522646094, 1.0693103890360447, 1.068023541951553, 1.0666527358153268, 1.065196998890723, 1.0636553631866676, 1.0620268647486668, 1.0603105439544234, 1.0585054458140613, 1.0566106202749452, 1.0546251225310965, 1.0525480133371956, 1.0503783593271574, 1.0481152333372707, 1.0457577147338897, 1.0433048897456514, 1.0407558518002133, 1.0381097018654795, 1.0353655487952973, 1.0325225096795982, 1.0295797101989528, 1.0265362849835122, 1.0233913779763009, 1.0201441428008262, 1.0167937431329657, 1.0133393530770922, 1.009780157546394], "zmax": null, "line": {"shape": "linear", "color": "rgba(0, 154, 250, 1.000)", "dash": "solid", "width": 1}, "zaxis": null, "yaxis": "y", "metadata": {"smartZoomParams": {"maxCount": 50, "minCount": 25000, "currentCount": 50}, "shouldEnableSmartZoom": false}, "type": "scatter"}, {"xaxis": "x", "mode": "lines", "x": [1, 2, 3, 4, 5, 6, 7, 8, 9, 10, 11, 12, 13, 14, 15, 16, 17, 18, 19, 20, 21, 22, 23, 24, 25, 26, 27, 28, 29, 30, 31, 32, 33, 34, 35, 36, 37, 38, 39, 40, 41, 42, 43, 44, 45, 46, 47, 48, 49, 50], "showlegend": true, "name": "Sine", "colorbar": {"title": {"text": ""}}, "zmin": null, "z": null, "legendgroup": "Sine", "y": [0, 0.030614674589207184, 0.056568542494923796, 0.07391036260090295, 0.08, 0.07391036260090295, 0.12927839464429086, 0.16496496301465122, 0.1755371111771445, 0.15938532541079284, 0.1189685686822207, 0.1331497779739082, 0.1270601405748111, 0.10162674857624159, 0.060721605355709196, 0.010572148162493356, -0.010572148162493057, -0.030106930766501824, -0.04505820608131758, -0.05314977797390798, -0.053149777973907936, -0.0450582060813174, -0.030106930766501727, -0.010572148162493123, 0.010572148162493345, 0.030106930766502046, 0.04505820608131787, 0.0531497779739082, 0.05314977797390809, 0.045058206081317644, 0.030106930766501904, 0.010572148162493276, -0.010572148162493179, -0.030106930766501894, -0.04505820608131765, -0.05314977797390798, -0.05314977797390791, -0.045058206081317345, -0.030106930766501665, -0.010572148162493043, 0.010572148162493467, 0.030106930766502116, 0.045058206081317956, 0.0531497779739082, 0.05314977797390806, 0.0450582060813176, 0.03010693076650181, 0.010572148162493224, -0.010572148162493269, -0.030106930766501977], "zmax": null, "line": {"shape": "linear", "color": "rgba(227, 111, 71, 1.000)", "dash": "solid", "width": 1}, "zaxis": null, "yaxis": "y", "metadata": {"smartZoomParams": {"maxCount": 50, "minCount": 25000, "currentCount": 50}, "shouldEnableSmartZoom": false}, "type": "scatter"}, {"xaxis": "x", "mode": "lines", "x": [1, 2, 3, 4, 5, 6, 7, 8, 9, 10, 11, 12, 13, 14, 15, 16, 17, 18, 19, 20, 21, 22, 23, 24, 25, 26, 27, 28, 29, 30, 31, 32, 33, 34, 35, 36, 37, 38, 39, 40, 41, 42, 43, 44, 45, 46, 47, 48, 49, 50], "showlegend": true, "name": "Signal", "colorbar": {"title": {"text": ""}}, "zmin": null, "z": null, "legendgroup": "Signal", "y": [-4.8828125e-06, 0, -1.46484375e-05, 9.765625e-06, -1.46484375e-05, 7.141113281250001e-05, 0.0007421875, 0.0007513427734375, 0.0008190917968750001, 0.0008685302734375, 0.0010644531249999999, 0.0024951171874999997, 0.0026428222656250003, 0.0028558349609375, 0.0029309082031249998, 0.0032464599609375003, 0.004376220703125, 0.0046319580078125, 0.00494384765625, 0.0047137451171875, 0.005286865234374999, 0.005324096679687499, 0.0054339599609375, 0.005758056640625001, 0.005169677734375, 0.0057824707031250006, 0.00541015625, 0.0052484130859375006, 0.0053961181640625, 0.0049169921875, 0.0050372314453125, 0.0052484130859375006, 0.004979248046875, 0.00497802734375, 0.004908447265625001, 0.0044061279296875, 0.0048663330078125, 0.0046966552734375, 0.0049005126953125, 0.004923095703125, 0.0042987060546874995, 0.0045050048828125, 0.0044427490234375, 0.0049017333984375, 0.004791259765625, 0.004420166015625, 0.004285888671875, 0.004237060546874999, 0.0046600341796875, 0.00451171875], "zmax": null, "line": {"shape": "linear", "color": "rgba(62, 164, 78, 1.000)", "dash": "solid", "width": 1}, "zaxis": null, "yaxis": "y", "metadata": {"smartZoomParams": {"maxCount": 50, "minCount": 25000, "currentCount": 50}, "shouldEnableSmartZoom": false}, "type": "scatter"}], "config": {"showlegend": true, "height": 400, "xaxis": {"showline": true, "showticklabels": true, "gridcolor": "rgba(0, 0, 0, 0.1)", "tickfont": {"family": "sans-serif", "color": "rgba(0, 0, 0, 1)", "size": 11}, "tickmode": "array", "anchor": "y", "ticktext": ["0", "10", "20", "30", "40", "50"], "range": [-0.4700000000000024, 51.47], "tickcolor": "rgb(0, 0, 0)", "gridwidth": 0.5, "visible": true, "tickvals": [0, 10, 20, 30, 40, 50], "showgrid": true, "linecolor": "rgba(0, 0, 0, 1)", "zerolinecolor": "rgba(0, 0, 0, 1)", "tickangle": 0, "zeroline": false, "mirror": false, "domain": [0.0658209390492855, 0.9934383202099738], "title": {"font": {"family": "sans-serif", "color": "rgba(0, 0, 0, 1)", "size": 15}, "text": ""}, "ticks": "inside", "type": "linear"}, "annotations": [], "plot_bgcolor": "rgba(255, 255, 255, 1.000)", "paper_bgcolor": "rgba(255, 255, 255, 1.000)", "margin": {"t": 20, "b": 20, "r": 0, "l": 0}, "yaxis": {"showline": true, "showticklabels": true, "gridcolor": "rgba(0, 0, 0, 0.1)", "tickfont": {"family": "sans-serif", "color": "rgba(0, 0, 0, 1)", "size": 11}, "tickmode": "array", "anchor": "x", "ticktext": ["0.00", "0.25", "0.50", "0.75", "1.00"], "range": [-0.08706254187405338, 1.1111884492644144], "tickcolor": "rgb(0, 0, 0)", "gridwidth": 0.5, "visible": true, "tickvals": [0, 0.25, 0.5, 0.75, 1], "showgrid": true, "linecolor": "rgba(0, 0, 0, 1)", "zerolinecolor": "rgba(0, 0, 0, 1)", "tickangle": 0, "zeroline": false, "mirror": false, "domain": [0.03762029746281716, 0.9901574803149606], "title": {"font": {"family": "sans-serif", "color": "rgba(0, 0, 0, 1)", "size": 15}, "text": ""}, "ticks": "inside", "type": "linear"}, "width": 525, "legend": {"x": 1, "traceorder": "normal", "yanchor": "auto", "font": {"family": "sans-serif", "color": "rgba(0, 0, 0, 1)", "size": 11}, "borderwidth": 1, "bordercolor": "rgba(0, 0, 0, 1)", "y": 1, "bgcolor": "rgba(255, 255, 255, 1.000)", "tracegroupgap": 0, "title": {"font": {"family": "sans-serif", "color": "rgba(0, 0, 0, 1)", "size": 15}, "text": ""}, "xanchor": "auto"}}}