Manual switching of logic circuits
In this example, we will show how to test or demonstrate the operation of a logic circuit by manually setting the necessary input signals using switches.
Description of the model
This model consists of a single block type Logic, the input of which is supplied with logical signals set by manual switches – blocks of the type Manual Switch.
By rearranging the input switches, we can set any acceptable combination of input signals and study the operation of the circuit in different conditions.
Model Execution
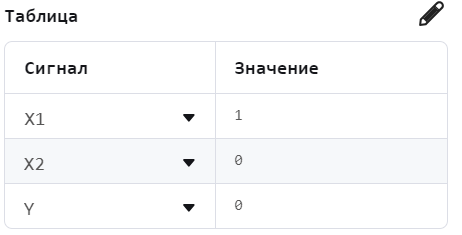
The output signal can be studied by running the model and opening the chart panel. There, the input and output data are collected in the form of a table.
.png)
Automatic verification of all combinations
We will organize automated testing of this model to see all the input combinations. At the same time, our goal will be not to change anything in the topology of the model, but only to rearrange the switches programmatically.
Upload the model (if necessary):
# If the model is not open yet, we will upload it from the file
if "switching_logic" ∉ [m.name for m in engee.get_all_models()] engee.load( "$(@__DIR__)/switching_logic.engee"); end;
Symbol ∉ you can copy it from the command line, where you can type the command \notin and press the tab key Tab.
To find out which parameters can be switched programmatically, call the command get_param.
engee.get_param( "switching_logic/Manual Switch" )
Now we will organize a cycle for all combinations of input conditions and build a table.:
X1 = [ false, true ]
X2 = [ false, true ]
Y = zeros( length(X1), length(X2) )

for (i,x1) in enumerate(X1)
    for (j,x2) in enumerate(X2)
        # Reset the switches to the desired state
        engee.set_param!( "switching_logic/Manual Switch", "PortValue"=>x1 )
        engee.set_param!( "switching_logic/Manual Switch-1", "PortValue"=>x2 )
        # Let's run the model with the new parameters
        data = engee.run( "switching_logic" )
        # Let's put the results in a matrix
        Y[i,j] = data["Y"].value[end]
    end
end
It should be borne in mind that each individual access to the model using software control takes about a second, regardless of the execution time of the model itself. For this reason, it is better to sort through the parameters within a not too large set of combinations.
Let's output the truth table:
gr()
heatmap( X1, X2, Y, xticks=([0,1],["lie", "truth"]), yticks=([0,1],["lie", "truth"]) )
And we'll build another graph in a different format.:
gr()
scatter(  repeat(X1, inner=2), repeat(X2, outer=2), zcolor=Y[:],
          markersize=40, xlimits=(-1.5,2.5), ylimits=(-0.5,1.5), size=(500,280),
          xticks=([0,1],["lie", "truth"]), yticks=([0,1],["lie", "truth"]),
          label=false )
Conclusion
The example shows how to easily simulate logic circuits by manually switching the values of the input signals, and then plot a graph for all input combinations.