Event counting with enabled and triggered subsystems
In this model we demonstrate the difference in the operation of the block enabled
and the block triggered
, which determine the conditions of triggering the subsystem. The demonstration is carried out on the example of counting events.
The model contains a pulse generator Pulse Generator
, which in the Sample based
mode controls the signal parameters based on the specified number of discrete simulation steps that must elapse between switches.
Next, the signal goes into two counter realisations:
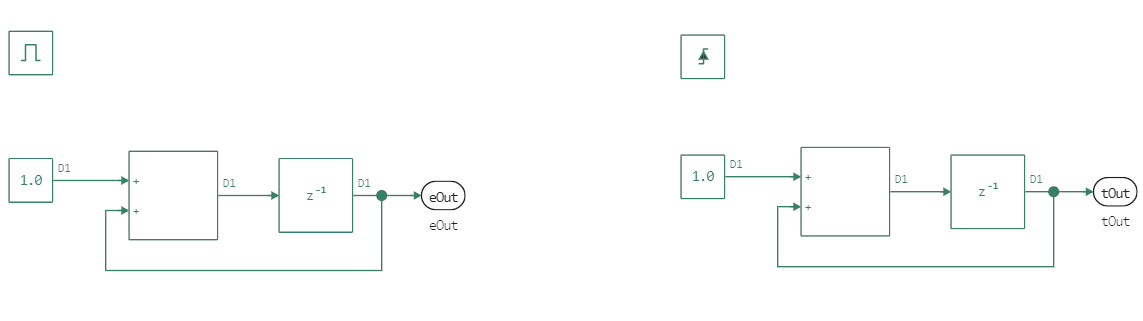
- one is implemented as a subsystem with a port
EnablePort
(triggered by the presence of a positive signal at the input,
- the other one is implemented as a subsystem
TriggerPort
, and it triggers when a rising edge of the signal is registered.
Both counters, when triggered, add one to their output signal. But, as we can see from the colouring, the triggering time (Sample Time
) of the second counter is determined by the operation of the TriggerPort
block, so the colour of the counter block differs from the colour of the other blocks in the system (for which the sampling time is set to 0.01).
The model allows us to study how different subsystem execution control blocks work. Let's run the model and analyse the results.
Out[0]:
Dict{String, DataFrames.DataFrame} with 3 entries:
"Счетчик Enabled" => 226×2 DataFrame…
"Счетчик Triggered" => 226×2 DataFrame…
"Сигнал управления" => 226×2 DataFrame…
The first signal demonstrates the operation of a discrete control signal source.
In the second graph we see the operation of enabled
-subsystem with triggering logic defined by EnablePort
. The counter increases with each simulation cycle when the subsystem receives a positive signal on the control port. While the subsystem is disabled, it returns the last accumulated value of the signal. When the positive control signal is resumed, the output is reset - this behaviour is set by the block configuration set EnablePort
.
In the third diagram we see the operation of triggered
-subsystem with the triggering logic set via TriggerPort
. With each rising edge of the control signal, the counter is incremented by 1.
Why does the counter "miss" the first two rising edges? There is a block in its circuit Unit Delay
, which returns 0 at the first triggering. And the first triggering of this block occurs not at the moment of t=0
, but at the moment of registration of the first rising edge:
- when the model is started, the control signal is initially at
1
and there is no rising pulse,
- when the first edge occurs, the counter is triggered for the first time and returns
0
,
- when the second edge is registered (third pulse) the counter will return
1
.
Using different modes of subsystems triggering in Engee it is possible to organise complex hybrid scenarios of simulation of discrete or continuous processes. We have seen this with two subsystem execution modifiers - EnablePort
and TriggerPort
, but Engee has several more such modifiers that allow you to set more complex subsystem conditions, which can be found in the Subsystems panel of the basic block library.
{"id": "c093ede7-2c8c-4a80-8466-b9501de85f7a", "data": [{"showlegend": true, "mode": "lines", "xaxis": "x", "colorbar": {"title": {"text": ""}}, "name": "y1", "zmin": null, "yaxis": "y", "legendgroup": "y1", "zmax": null, "line": {"color": "rgba(0, 154, 250, 1.000)", "shape": "linear", "dash": "solid", "width": 1}, "y": [1, 1, 1, 1, 1, 1, 1, 1, 1, 1, 1, 1, 1, 1, 1, 1, 1, 1, 1, 1, 0, 0, 0, 0, 0, 0, 0, 0, 0, 0, 0, 0, 0, 0, 0, 0, 0, 0, 0, 0, 1, 1, 1, 1, 1, 1, 1, 1, 1, 1, 1, 1, 1, 1, 1, 1, 1, 1, 1, 1, 0, 0, 0, 0, 0, 0, 0, 0, 0, 0, 0, 0, 0, 0, 0, 0, 0, 0, 0, 0, 1, 1, 1, 1, 1, 1, 1, 1, 1, 1, 1, 1, 1, 1, 1, 1, 1, 1, 1, 1, 0, 0, 0, 0, 0, 0, 0, 0, 0, 0, 0, 0, 0, 0, 0, 0, 0, 0, 0, 0, 1, 1, 1, 1, 1, 1, 1, 1, 1, 1, 1, 1, 1, 1, 1, 1, 1, 1, 1, 1, 0, 0, 0, 0, 0, 0, 0, 0, 0, 0, 0, 0, 0, 0, 0, 0, 0, 0, 0, 0, 1, 1, 1, 1, 1, 1, 1, 1, 1, 1, 1, 1, 1, 1, 1, 1, 1, 1, 1, 1, 0, 0, 0, 0, 0, 0, 0, 0, 0, 0, 0, 0, 0, 0, 0, 0, 0, 0, 0, 0, 1, 1, 1, 1, 1, 1, 1, 1, 1, 1, 1, 1, 1, 1, 1, 1, 1, 1, 1, 1, 0, 0, 0, 0, 0, 0], "type": "scatter", "x": [0, 0.01, 0.02, 0.03, 0.04, 0.05, 0.06, 0.07, 0.08, 0.09, 0.1, 0.11, 0.12, 0.13, 0.14, 0.15, 0.16, 0.17, 0.18, 0.19, 0.2, 0.21, 0.22, 0.23, 0.24, 0.25, 0.26, 0.27, 0.28, 0.29, 0.3, 0.31, 0.32, 0.33, 0.34, 0.35, 0.36, 0.37, 0.38, 0.39, 0.4, 0.41, 0.42, 0.43, 0.44, 0.45, 0.46, 0.47, 0.48, 0.49, 0.5, 0.51, 0.52, 0.53, 0.54, 0.55, 0.56, 0.57, 0.58, 0.59, 0.6, 0.61, 0.62, 0.63, 0.64, 0.65, 0.66, 0.67, 0.68, 0.69, 0.7, 0.71, 0.72, 0.73, 0.74, 0.75, 0.76, 0.77, 0.78, 0.79, 0.8, 0.81, 0.82, 0.83, 0.84, 0.85, 0.86, 0.87, 0.88, 0.89, 0.9, 0.91, 0.92, 0.93, 0.94, 0.95, 0.96, 0.97, 0.98, 0.99, 1, 1.01, 1.02, 1.03, 1.04, 1.05, 1.06, 1.07, 1.08, 1.09, 1.1, 1.11, 1.12, 1.13, 1.14, 1.15, 1.16, 1.17, 1.18, 1.19, 1.2, 1.21, 1.22, 1.23, 1.24, 1.25, 1.26, 1.27, 1.28, 1.29, 1.3, 1.31, 1.32, 1.33, 1.34, 1.35, 1.36, 1.37, 1.38, 1.39, 1.4, 1.41, 1.42, 1.43, 1.44, 1.45, 1.46, 1.47, 1.48, 1.49, 1.5, 1.51, 1.52, 1.53, 1.54, 1.55, 1.56, 1.57, 1.58, 1.59, 1.6, 1.61, 1.62, 1.63, 1.64, 1.65, 1.66, 1.67, 1.68, 1.69, 1.7, 1.71, 1.72, 1.73, 1.74, 1.75, 1.76, 1.77, 1.78, 1.79, 1.8, 1.81, 1.82, 1.83, 1.84, 1.85, 1.86, 1.87, 1.88, 1.89, 1.9, 1.91, 1.92, 1.93, 1.94, 1.95, 1.96, 1.97, 1.98, 1.99, 2, 2.01, 2.02, 2.03, 2.04, 2.05, 2.06, 2.07, 2.08, 2.09, 2.1, 2.11, 2.12, 2.13, 2.14, 2.15, 2.16, 2.17, 2.18, 2.19, 2.2, 2.21, 2.22, 2.23, 2.24, 2.25], "zaxis": null, "z": null, "metadata": {"shouldEnableSmartZoom": false, "smartZoomParams": {"minCount": 25000, "maxCount": 226, "currentCount": 226}}}], "config": {"showlegend": true, "xaxis": {"showticklabels": true, "gridwidth": 0.5, "range": [-0.06750000000000012, 2.3175], "domain": [0.0658209390492855, 0.9934383202099738], "mirror": false, "tickangle": 0, "showline": true, "zeroline": false, "tickfont": {"color": "rgba(0, 0, 0, 1)", "family": "sans-serif", "size": 11}, "zerolinecolor": "rgba(0, 0, 0, 1)", "anchor": "y", "visible": true, "ticks": "inside", "tickmode": "array", "linecolor": "rgba(0, 0, 0, 1)", "showgrid": true, "title": {"text": "", "font": {"color": "rgba(0, 0, 0, 1)", "family": "sans-serif", "size": 15}}, "gridcolor": "rgba(0, 0, 0, 0.1)", "tickcolor": "rgb(0, 0, 0)", "type": "linear"}, "paper_bgcolor": "rgba(255, 255, 255, 1.000)", "annotations": [], "height": 400, "margin": {"l": 0, "b": 20, "r": 0, "t": 20}, "plot_bgcolor": "rgba(255, 255, 255, 1.000)", "yaxis": {"showticklabels": true, "gridwidth": 0.5, "range": [-0.030000000000000027, 1.03], "domain": [0.03762029746281716, 0.9901574803149606], "mirror": false, "tickangle": 0, "showline": true, "zeroline": false, "tickfont": {"color": "rgba(0, 0, 0, 1)", "family": "sans-serif", "size": 11}, "zerolinecolor": "rgba(0, 0, 0, 1)", "anchor": "x", "visible": true, "ticks": "inside", "tickmode": "array", "linecolor": "rgba(0, 0, 0, 1)", "showgrid": true, "title": {"text": "", "font": {"color": "rgba(0, 0, 0, 1)", "family": "sans-serif", "size": 15}}, "gridcolor": "rgba(0, 0, 0, 0.1)", "tickcolor": "rgb(0, 0, 0)", "type": "linear"}, "legend": {"yanchor": "auto", "xanchor": "auto", "bordercolor": "rgba(0, 0, 0, 1)", "bgcolor": "rgba(255, 255, 255, 1.000)", "borderwidth": 1, "tracegroupgap": 0, "y": 1, "font": {"color": "rgba(0, 0, 0, 1)", "family": "sans-serif", "size": 11}, "title": {"font": {"color": "rgba(0, 0, 0, 1)", "family": "sans-serif", "size": 15}, "text": ""}, "traceorder": "normal", "x": 1}, "width": 1104.84375}}
{"id": "d3796dd5-fe93-4ba4-b4b0-41c279455878", "data": [{"showlegend": true, "mode": "lines", "xaxis": "x", "colorbar": {"title": {"text": ""}}, "name": "y1", "zmin": null, "yaxis": "y", "legendgroup": "y1", "zmax": null, "line": {"color": "rgba(0, 154, 250, 1.000)", "shape": "linear", "dash": "solid", "width": 1}, "y": [0, 1, 2, 3, 4, 5, 6, 7, 8, 9, 10, 11, 12, 13, 14, 15, 16, 17, 18, 19, 19, 19, 19, 19, 19, 19, 19, 19, 19, 19, 19, 19, 19, 19, 19, 19, 19, 19, 19, 19, 0, 1, 2, 3, 4, 5, 6, 7, 8, 9, 10, 11, 12, 13, 14, 15, 16, 17, 18, 19, 19, 19, 19, 19, 19, 19, 19, 19, 19, 19, 19, 19, 19, 19, 19, 19, 19, 19, 19, 19, 0, 1, 2, 3, 4, 5, 6, 7, 8, 9, 10, 11, 12, 13, 14, 15, 16, 17, 18, 19, 19, 19, 19, 19, 19, 19, 19, 19, 19, 19, 19, 19, 19, 19, 19, 19, 19, 19, 19, 19, 0, 1, 2, 3, 4, 5, 6, 7, 8, 9, 10, 11, 12, 13, 14, 15, 16, 17, 18, 19, 19, 19, 19, 19, 19, 19, 19, 19, 19, 19, 19, 19, 19, 19, 19, 19, 19, 19, 19, 19, 0, 1, 2, 3, 4, 5, 6, 7, 8, 9, 10, 11, 12, 13, 14, 15, 16, 17, 18, 19, 19, 19, 19, 19, 19, 19, 19, 19, 19, 19, 19, 19, 19, 19, 19, 19, 19, 19, 19, 19, 0, 1, 2, 3, 4, 5, 6, 7, 8, 9, 10, 11, 12, 13, 14, 15, 16, 17, 18, 19, 19, 19, 19, 19, 19, 19], "type": "scatter", "x": [0, 0.01, 0.02, 0.03, 0.04, 0.05, 0.06, 0.07, 0.08, 0.09, 0.1, 0.11, 0.12, 0.13, 0.14, 0.15, 0.16, 0.17, 0.18, 0.19, 0.2, 0.21, 0.22, 0.23, 0.24, 0.25, 0.26, 0.27, 0.28, 0.29, 0.3, 0.31, 0.32, 0.33, 0.34, 0.35, 0.36, 0.37, 0.38, 0.39, 0.4, 0.41, 0.42, 0.43, 0.44, 0.45, 0.46, 0.47, 0.48, 0.49, 0.5, 0.51, 0.52, 0.53, 0.54, 0.55, 0.56, 0.57, 0.58, 0.59, 0.6, 0.61, 0.62, 0.63, 0.64, 0.65, 0.66, 0.67, 0.68, 0.69, 0.7, 0.71, 0.72, 0.73, 0.74, 0.75, 0.76, 0.77, 0.78, 0.79, 0.8, 0.81, 0.82, 0.83, 0.84, 0.85, 0.86, 0.87, 0.88, 0.89, 0.9, 0.91, 0.92, 0.93, 0.94, 0.95, 0.96, 0.97, 0.98, 0.99, 1, 1.01, 1.02, 1.03, 1.04, 1.05, 1.06, 1.07, 1.08, 1.09, 1.1, 1.11, 1.12, 1.13, 1.14, 1.15, 1.16, 1.17, 1.18, 1.19, 1.2, 1.21, 1.22, 1.23, 1.24, 1.25, 1.26, 1.27, 1.28, 1.29, 1.3, 1.31, 1.32, 1.33, 1.34, 1.35, 1.36, 1.37, 1.38, 1.39, 1.4, 1.41, 1.42, 1.43, 1.44, 1.45, 1.46, 1.47, 1.48, 1.49, 1.5, 1.51, 1.52, 1.53, 1.54, 1.55, 1.56, 1.57, 1.58, 1.59, 1.6, 1.61, 1.62, 1.63, 1.64, 1.65, 1.66, 1.67, 1.68, 1.69, 1.7, 1.71, 1.72, 1.73, 1.74, 1.75, 1.76, 1.77, 1.78, 1.79, 1.8, 1.81, 1.82, 1.83, 1.84, 1.85, 1.86, 1.87, 1.88, 1.89, 1.9, 1.91, 1.92, 1.93, 1.94, 1.95, 1.96, 1.97, 1.98, 1.99, 2, 2.01, 2.02, 2.03, 2.04, 2.05, 2.06, 2.07, 2.08, 2.09, 2.1, 2.11, 2.12, 2.13, 2.14, 2.15, 2.16, 2.17, 2.18, 2.19, 2.2, 2.21, 2.22, 2.23, 2.24, 2.25], "zaxis": null, "z": null, "metadata": {"shouldEnableSmartZoom": false, "smartZoomParams": {"minCount": 25000, "maxCount": 226, "currentCount": 226}}}], "config": {"showlegend": true, "xaxis": {"showticklabels": true, "gridwidth": 0.5, "range": [-0.06750000000000012, 2.3175], "domain": [0.03619130941965587, 0.9934383202099738], "mirror": false, "tickangle": 0, "showline": true, "zeroline": false, "tickfont": {"color": "rgba(0, 0, 0, 1)", "family": "sans-serif", "size": 11}, "zerolinecolor": "rgba(0, 0, 0, 1)", "anchor": "y", "visible": true, "ticks": "inside", "tickmode": "array", "linecolor": "rgba(0, 0, 0, 1)", "showgrid": true, "title": {"text": "", "font": {"color": "rgba(0, 0, 0, 1)", "family": "sans-serif", "size": 15}}, "gridcolor": "rgba(0, 0, 0, 0.1)", "tickcolor": "rgb(0, 0, 0)", "type": "linear"}, "paper_bgcolor": "rgba(255, 255, 255, 1.000)", "annotations": [], "height": 400, "margin": {"l": 0, "b": 20, "r": 0, "t": 20}, "plot_bgcolor": "rgba(255, 255, 255, 1.000)", "yaxis": {"showticklabels": true, "gridwidth": 0.5, "range": [-0.5700000000000003, 19.57], "domain": [0.03762029746281716, 0.9901574803149606], "mirror": false, "tickangle": 0, "showline": true, "zeroline": false, "tickfont": {"color": "rgba(0, 0, 0, 1)", "family": "sans-serif", "size": 11}, "zerolinecolor": "rgba(0, 0, 0, 1)", "anchor": "x", "visible": true, "ticks": "inside", "tickmode": "array", "linecolor": "rgba(0, 0, 0, 1)", "showgrid": true, "title": {"text": "", "font": {"color": "rgba(0, 0, 0, 1)", "family": "sans-serif", "size": 15}}, "gridcolor": "rgba(0, 0, 0, 0.1)", "tickcolor": "rgb(0, 0, 0)", "type": "linear"}, "legend": {"yanchor": "auto", "xanchor": "auto", "bordercolor": "rgba(0, 0, 0, 1)", "bgcolor": "rgba(255, 255, 255, 1.000)", "borderwidth": 1, "tracegroupgap": 0, "y": 1, "font": {"color": "rgba(0, 0, 0, 1)", "family": "sans-serif", "size": 11}, "title": {"font": {"color": "rgba(0, 0, 0, 1)", "family": "sans-serif", "size": 15}, "text": ""}, "traceorder": "normal", "x": 1}, "width": 1104.84375}}
{"id": "dc1f2b45-0823-48e9-9967-76a78b3f4805", "data": [{"showlegend": true, "mode": "lines", "xaxis": "x", "colorbar": {"title": {"text": ""}}, "name": "y1", "zmin": null, "yaxis": "y", "legendgroup": "y1", "zmax": null, "line": {"color": "rgba(0, 154, 250, 1.000)", "shape": "linear", "dash": "solid", "width": 1}, "y": [0, 0, 0, 0, 0, 0, 0, 0, 0, 0, 0, 0, 0, 0, 0, 0, 0, 0, 0, 0, 0, 0, 0, 0, 0, 0, 0, 0, 0, 0, 0, 0, 0, 0, 0, 0, 0, 0, 0, 0, 0, 0, 0, 0, 0, 0, 0, 0, 0, 0, 0, 0, 0, 0, 0, 0, 0, 0, 0, 0, 0, 0, 0, 0, 0, 0, 0, 0, 0, 0, 0, 0, 0, 0, 0, 0, 0, 0, 0, 0, 1, 1, 1, 1, 1, 1, 1, 1, 1, 1, 1, 1, 1, 1, 1, 1, 1, 1, 1, 1, 1, 1, 1, 1, 1, 1, 1, 1, 1, 1, 1, 1, 1, 1, 1, 1, 1, 1, 1, 1, 2, 2, 2, 2, 2, 2, 2, 2, 2, 2, 2, 2, 2, 2, 2, 2, 2, 2, 2, 2, 2, 2, 2, 2, 2, 2, 2, 2, 2, 2, 2, 2, 2, 2, 2, 2, 2, 2, 2, 2, 3, 3, 3, 3, 3, 3, 3, 3, 3, 3, 3, 3, 3, 3, 3, 3, 3, 3, 3, 3, 3, 3, 3, 3, 3, 3, 3, 3, 3, 3, 3, 3, 3, 3, 3, 3, 3, 3, 3, 3, 4, 4, 4, 4, 4, 4, 4, 4, 4, 4, 4, 4, 4, 4, 4, 4, 4, 4, 4, 4, 4, 4, 4, 4, 4, 4], "type": "scatter", "x": [0, 0.01, 0.02, 0.03, 0.04, 0.05, 0.06, 0.07, 0.08, 0.09, 0.1, 0.11, 0.12, 0.13, 0.14, 0.15, 0.16, 0.17, 0.18, 0.19, 0.2, 0.21, 0.22, 0.23, 0.24, 0.25, 0.26, 0.27, 0.28, 0.29, 0.3, 0.31, 0.32, 0.33, 0.34, 0.35, 0.36, 0.37, 0.38, 0.39, 0.4, 0.41, 0.42, 0.43, 0.44, 0.45, 0.46, 0.47, 0.48, 0.49, 0.5, 0.51, 0.52, 0.53, 0.54, 0.55, 0.56, 0.57, 0.58, 0.59, 0.6, 0.61, 0.62, 0.63, 0.64, 0.65, 0.66, 0.67, 0.68, 0.69, 0.7, 0.71, 0.72, 0.73, 0.74, 0.75, 0.76, 0.77, 0.78, 0.79, 0.8, 0.81, 0.82, 0.83, 0.84, 0.85, 0.86, 0.87, 0.88, 0.89, 0.9, 0.91, 0.92, 0.93, 0.94, 0.95, 0.96, 0.97, 0.98, 0.99, 1, 1.01, 1.02, 1.03, 1.04, 1.05, 1.06, 1.07, 1.08, 1.09, 1.1, 1.11, 1.12, 1.13, 1.14, 1.15, 1.16, 1.17, 1.18, 1.19, 1.2, 1.21, 1.22, 1.23, 1.24, 1.25, 1.26, 1.27, 1.28, 1.29, 1.3, 1.31, 1.32, 1.33, 1.34, 1.35, 1.36, 1.37, 1.38, 1.39, 1.4, 1.41, 1.42, 1.43, 1.44, 1.45, 1.46, 1.47, 1.48, 1.49, 1.5, 1.51, 1.52, 1.53, 1.54, 1.55, 1.56, 1.57, 1.58, 1.59, 1.6, 1.61, 1.62, 1.63, 1.64, 1.65, 1.66, 1.67, 1.68, 1.69, 1.7, 1.71, 1.72, 1.73, 1.74, 1.75, 1.76, 1.77, 1.78, 1.79, 1.8, 1.81, 1.82, 1.83, 1.84, 1.85, 1.86, 1.87, 1.88, 1.89, 1.9, 1.91, 1.92, 1.93, 1.94, 1.95, 1.96, 1.97, 1.98, 1.99, 2, 2.01, 2.02, 2.03, 2.04, 2.05, 2.06, 2.07, 2.08, 2.09, 2.1, 2.11, 2.12, 2.13, 2.14, 2.15, 2.16, 2.17, 2.18, 2.19, 2.2, 2.21, 2.22, 2.23, 2.24, 2.25], "zaxis": null, "z": null, "metadata": {"shouldEnableSmartZoom": false, "smartZoomParams": {"minCount": 25000, "maxCount": 226, "currentCount": 226}}}], "config": {"showlegend": true, "xaxis": {"showticklabels": true, "gridwidth": 0.5, "range": [-0.06750000000000012, 2.3175], "domain": [0.02137649460484106, 0.9934383202099737], "mirror": false, "tickangle": 0, "showline": true, "zeroline": false, "tickfont": {"color": "rgba(0, 0, 0, 1)", "family": "sans-serif", "size": 11}, "zerolinecolor": "rgba(0, 0, 0, 1)", "anchor": "y", "visible": true, "ticks": "inside", "tickmode": "array", "linecolor": "rgba(0, 0, 0, 1)", "showgrid": true, "title": {"text": "", "font": {"color": "rgba(0, 0, 0, 1)", "family": "sans-serif", "size": 15}}, "gridcolor": "rgba(0, 0, 0, 0.1)", "tickcolor": "rgb(0, 0, 0)", "type": "linear"}, "paper_bgcolor": "rgba(255, 255, 255, 1.000)", "annotations": [], "height": 400, "margin": {"l": 0, "b": 20, "r": 0, "t": 20}, "plot_bgcolor": "rgba(255, 255, 255, 1.000)", "yaxis": {"showticklabels": true, "gridwidth": 0.5, "range": [-0.1200000000000001, 4.12], "domain": [0.03762029746281716, 0.9901574803149606], "mirror": false, "tickangle": 0, "showline": true, "zeroline": false, "tickfont": {"color": "rgba(0, 0, 0, 1)", "family": "sans-serif", "size": 11}, "zerolinecolor": "rgba(0, 0, 0, 1)", "anchor": "x", "visible": true, "ticks": "inside", "tickmode": "array", "linecolor": "rgba(0, 0, 0, 1)", "showgrid": true, "title": {"text": "", "font": {"color": "rgba(0, 0, 0, 1)", "family": "sans-serif", "size": 15}}, "gridcolor": "rgba(0, 0, 0, 0.1)", "tickcolor": "rgb(0, 0, 0)", "type": "linear"}, "legend": {"yanchor": "auto", "xanchor": "auto", "bordercolor": "rgba(0, 0, 0, 1)", "bgcolor": "rgba(255, 255, 255, 1.000)", "borderwidth": 1, "tracegroupgap": 0, "y": 1, "font": {"color": "rgba(0, 0, 0, 1)", "family": "sans-serif", "size": 11}, "title": {"font": {"color": "rgba(0, 0, 0, 1)", "family": "sans-serif", "size": 15}, "text": ""}, "traceorder": "normal", "x": 1}, "width": 1104.84375}}