Ratio-to-speed converter using command control in cycles
The converter takes the ratio and converts it to speed.
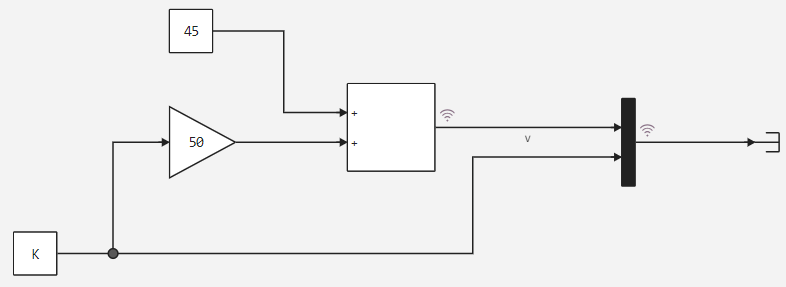
The mathematical model of the converter is an algebraic equation, where the range of positions K = 0 to 1 and corresponds to the
speed range v = 45 to 95 km/h.
The total velocity is
v = 50x + 45, the figure below shows the realised model itself.

Next, let's connect the auxiliary function to start the model and declare initial states for it.
Out[0]:
run_model (generic function with 1 method)
Let's set the starting conditions as follows:
Let's run the model in a cycle changing the value of r.
Building...
Progress 100%
Building...
Progress 100%
Building...
Progress 100%
Building...
Progress 100%
Building...
Progress 100%
Building...
Progress 100%
Display and compare the obtained results, plot the final speed and input coefficients.
Conclusion
According to the results of the model, we can see that as the coefficient increases, the speed increases accordingly.
{"id": "b42334cc-68db-42af-8e69-7bb69eb6db50", "data": [{"showlegend": true, "mode": "lines", "xaxis": "x", "colorbar": {"title": {"text": ""}}, "name": "y1", "zmin": null, "yaxis": "y", "legendgroup": "y1", "zmax": null, "line": {"color": "rgba(0, 154, 250, 1.000)", "shape": "linear", "dash": "solid", "width": 1}, "y": [45, 55, 65, 75, 85, 95], "type": "scatter", "x": [0, 0.2, 0.4, 0.6, 0.8, 1], "zaxis": null, "z": null, "metadata": {"shouldEnableSmartZoom": false, "smartZoomParams": {"minCount": 25000, "maxCount": 6, "currentCount": 6}}}], "config": {"showlegend": true, "xaxis": {"showticklabels": true, "gridwidth": 0.5, "range": [-0.030000000000000027, 1.03], "domain": [0.03619130941965587, 0.9934383202099738], "mirror": false, "tickangle": 0, "showline": true, "zeroline": false, "tickfont": {"color": "rgba(0, 0, 0, 1)", "family": "sans-serif", "size": 11}, "zerolinecolor": "rgba(0, 0, 0, 1)", "anchor": "y", "visible": true, "ticks": "inside", "tickmode": "array", "linecolor": "rgba(0, 0, 0, 1)", "showgrid": true, "title": {"text": "", "font": {"color": "rgba(0, 0, 0, 1)", "family": "sans-serif", "size": 15}}, "gridcolor": "rgba(0, 0, 0, 0.1)", "tickcolor": "rgb(0, 0, 0)", "type": "linear"}, "paper_bgcolor": "rgba(255, 255, 255, 1.000)", "annotations": [], "height": 400, "margin": {"l": 0, "b": 20, "r": 0, "t": 20}, "plot_bgcolor": "rgba(255, 255, 255, 1.000)", "yaxis": {"showticklabels": true, "gridwidth": 0.5, "range": [43.5, 96.5], "domain": [0.03762029746281716, 0.9901574803149606], "mirror": false, "tickangle": 0, "showline": true, "zeroline": false, "tickfont": {"color": "rgba(0, 0, 0, 1)", "family": "sans-serif", "size": 11}, "zerolinecolor": "rgba(0, 0, 0, 1)", "anchor": "x", "visible": true, "ticks": "inside", "tickmode": "array", "linecolor": "rgba(0, 0, 0, 1)", "showgrid": true, "title": {"text": "", "font": {"color": "rgba(0, 0, 0, 1)", "family": "sans-serif", "size": 15}}, "gridcolor": "rgba(0, 0, 0, 0.1)", "tickcolor": "rgb(0, 0, 0)", "type": "linear"}, "legend": {"yanchor": "auto", "xanchor": "auto", "bordercolor": "rgba(0, 0, 0, 1)", "bgcolor": "rgba(255, 255, 255, 1.000)", "borderwidth": 1, "tracegroupgap": 0, "y": 1, "font": {"color": "rgba(0, 0, 0, 1)", "family": "sans-serif", "size": 11}, "title": {"font": {"color": "rgba(0, 0, 0, 1)", "family": "sans-serif", "size": 15}, "text": ""}, "traceorder": "normal", "x": 1}, "width": 319}}