Cross-domain in models
In this example, we will consider two simple models whose purpose is to demonstrate the possibilities of changing the signal frequency due to the Upsample and Downsample blocks. In the first case, we will change the number of samples for specific data, this model option is shown in the figure below.
The second model performs all the same transformations, but it already works with cars.
As we can see from the images, each block of these systems is colored in its own color, which indicates a difference in the frequency of the signal at the output of each block.
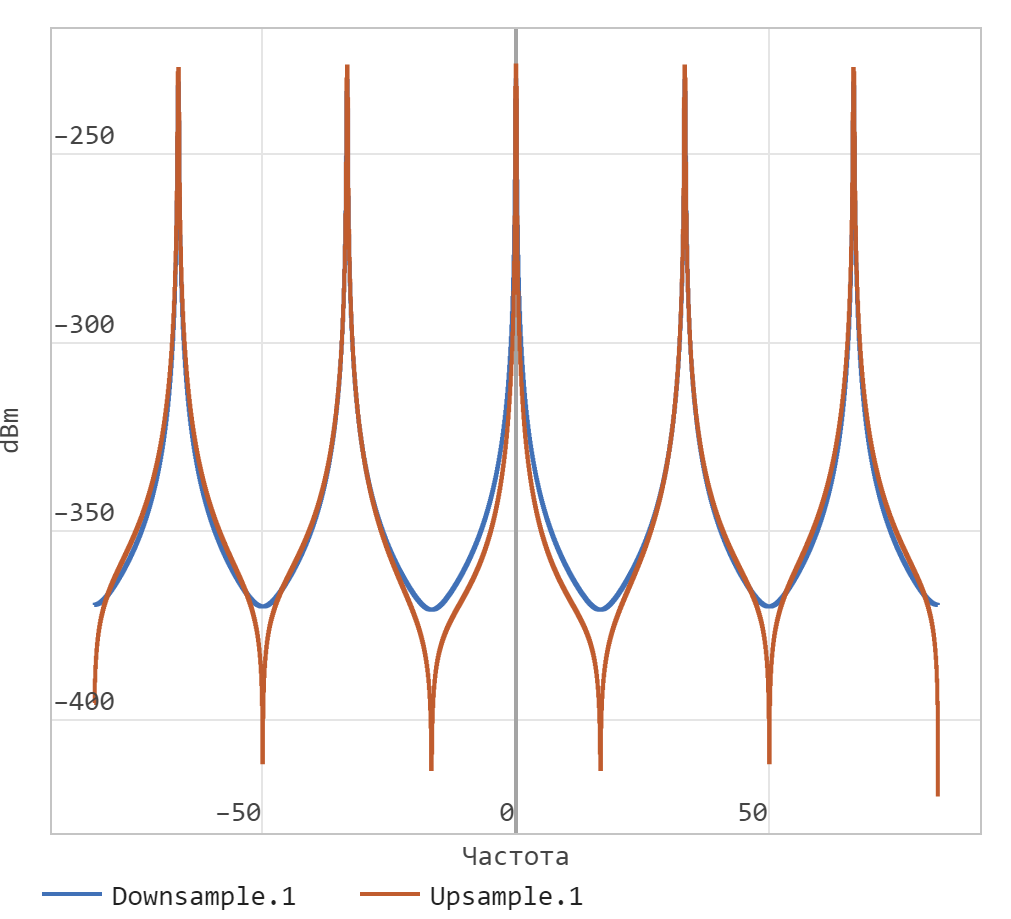
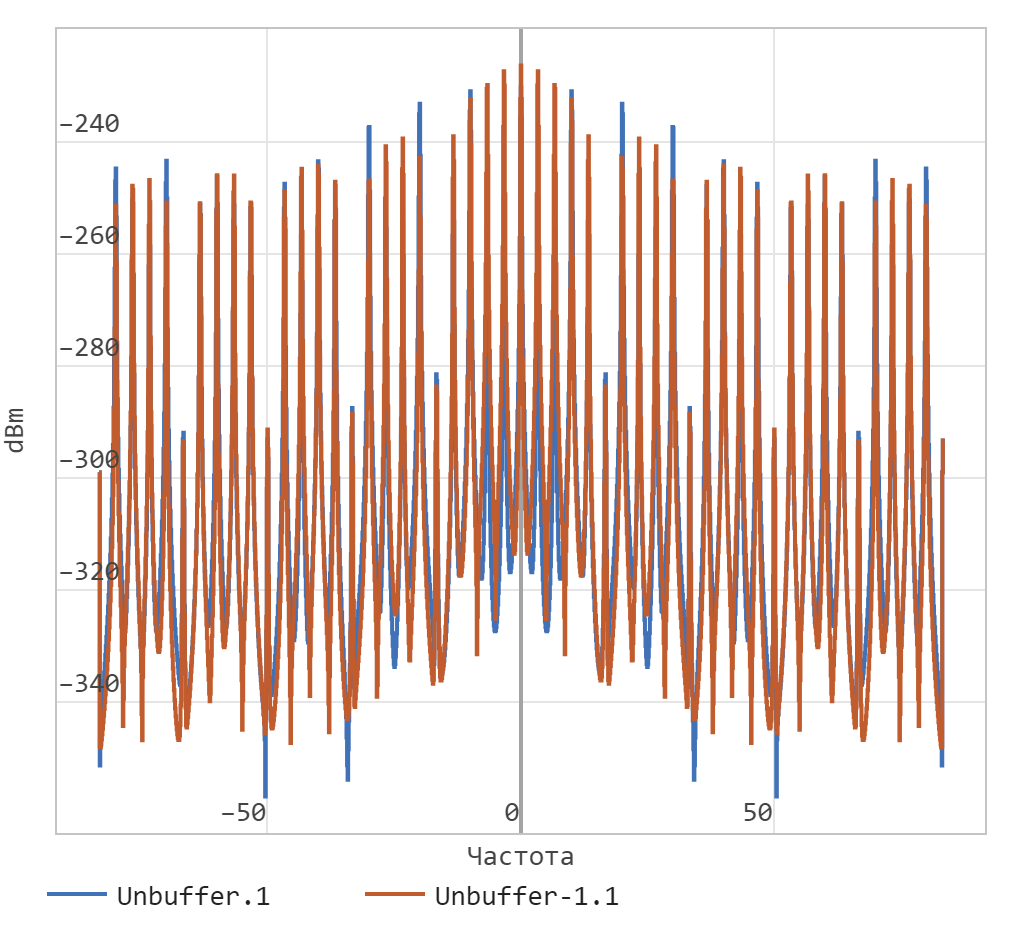
Next, to visualize the results, we will plot the signal spectra from both models using the graph window in the model.
.png)
.png)
Conclusion
As we can see from these two graphs, the use of Upsample and Downsample blocks directly affects the display of the signal in the frequency domain.