Managing the Engee model using a web application
In this demo, we will analyze the principles of implementing model management applications and compare two model management options using GenieFramework and Engee command management.
We will consider these aspects using the example of a sine wave generator model and tracking the signal output. We will set the "simulation time" parameter as "infinite".
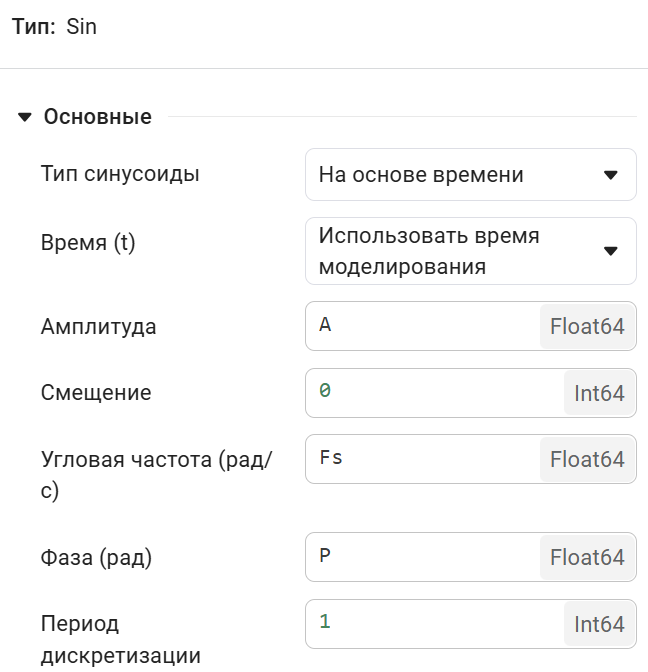
The first option for managing such a model is to explicitly specify parameters from the Engee workspace.
.png)
Now let's look at the logic of the application itself in more detail. The logic and interface itself are presented in the app.jl file. This code creates an interactive web application using the GenieFramework framework and the StippleUI and PlotlyBase libraries for visualization. The application allows you to control the parameters of the sinusoidal signal through sliders and displays a graph in real time.
Block @app defines the data model:
@app begin
    @in A = 1.0      # Амплитуда сигнала (начальное значение 1.0)
    @in Fs = 1.0     # Частота сигнала (начальное значение 1.0)
    @in P = 0.0      # Фаза сигнала (начальное значение 0.0)

    @out plotdata = [scatter(x=vec(T), y=vec(sin.(2π .* T)))]  # Начальные данные графика
    @out plotlayout = PlotlyBase.Layout(  # Настройки отображения графика
        xaxis=attr(title="Время", showgrid=true),
        yaxis=attr(title="Значение", showgrid=true)
    )
When we change the parameters A, Fs or P, we update the graph and transfer the data to the model, but as you can see, we do this not through the Engee workspace, but through the command set_param:
    @onchange A, Fs, P begin
        # Обновление данных графика с новыми параметрами
        plotdata = [scatter(x=vec(T), y=vec(A .* sin.(2π * Fs .* T .+ P)))]

        # Отправка параметров через Engee
        engee.genie.send("A", A)
        engee.genie.send("Fs", Fs)
        engee.genie.send("P", P)

        # Установка параметров в модуль SIN/Sin
        engee.set_param!("SIN/Sin",
                 "Amplitude" => Float64(A),
                 "Frequency" => Float64(Fs),
                 "Phase" => Float64(P))
    end
end
Function ui() defines the structure of a web page:
function ui()
    row([
        column([  # Левая колонка с элементами управления
            h6("Амплитуда = {{A}}", style="margin-bottom: -10px"),
            slider(0.1:0.20:10, :A, color="red", style="margin-bottom: 20px"),

            h6("Частота = {{Fs}}", style="margin-bottom: -10px"),
            slider(0.1:0.20:10, :Fs, color="green", style="margin-bottom: 20px"),

            h6("Фаза = {{P}}", style="margin-bottom: -10px"),
            slider(0.0:0.20:2π, :P, color="blue", style="margin-bottom: 20px")
            ], style="width: 40%; padding: 20px;"),

        column([  # Правая колонка с графиком
            plot(:plotdata, layout=:plotlayout)
        ], style="width: 60%; padding: 20px; background-color: #f9f9f9; border-radius: 10px;")
    ])
end
Creating a route for the home page:
@page("/", ui, debounce=1)
Next, we will run our application using GenieFramework.
app_url = string(engee.genie.start(string(@__DIR__,"/app.jl")))
app_url = replace((match(r"https?://[^\s\\]+", app_url)).match, r"\e$" => "")
println("URL: $app_url")
The application can be opened either by clicking on the link or by launching it inside. ngscript.
# display(
# MIME("text/html"),
# """<iframe
# src="$app_url"
# width="750" height="500"
# style="border: none;">
# </iframe>"""
# )
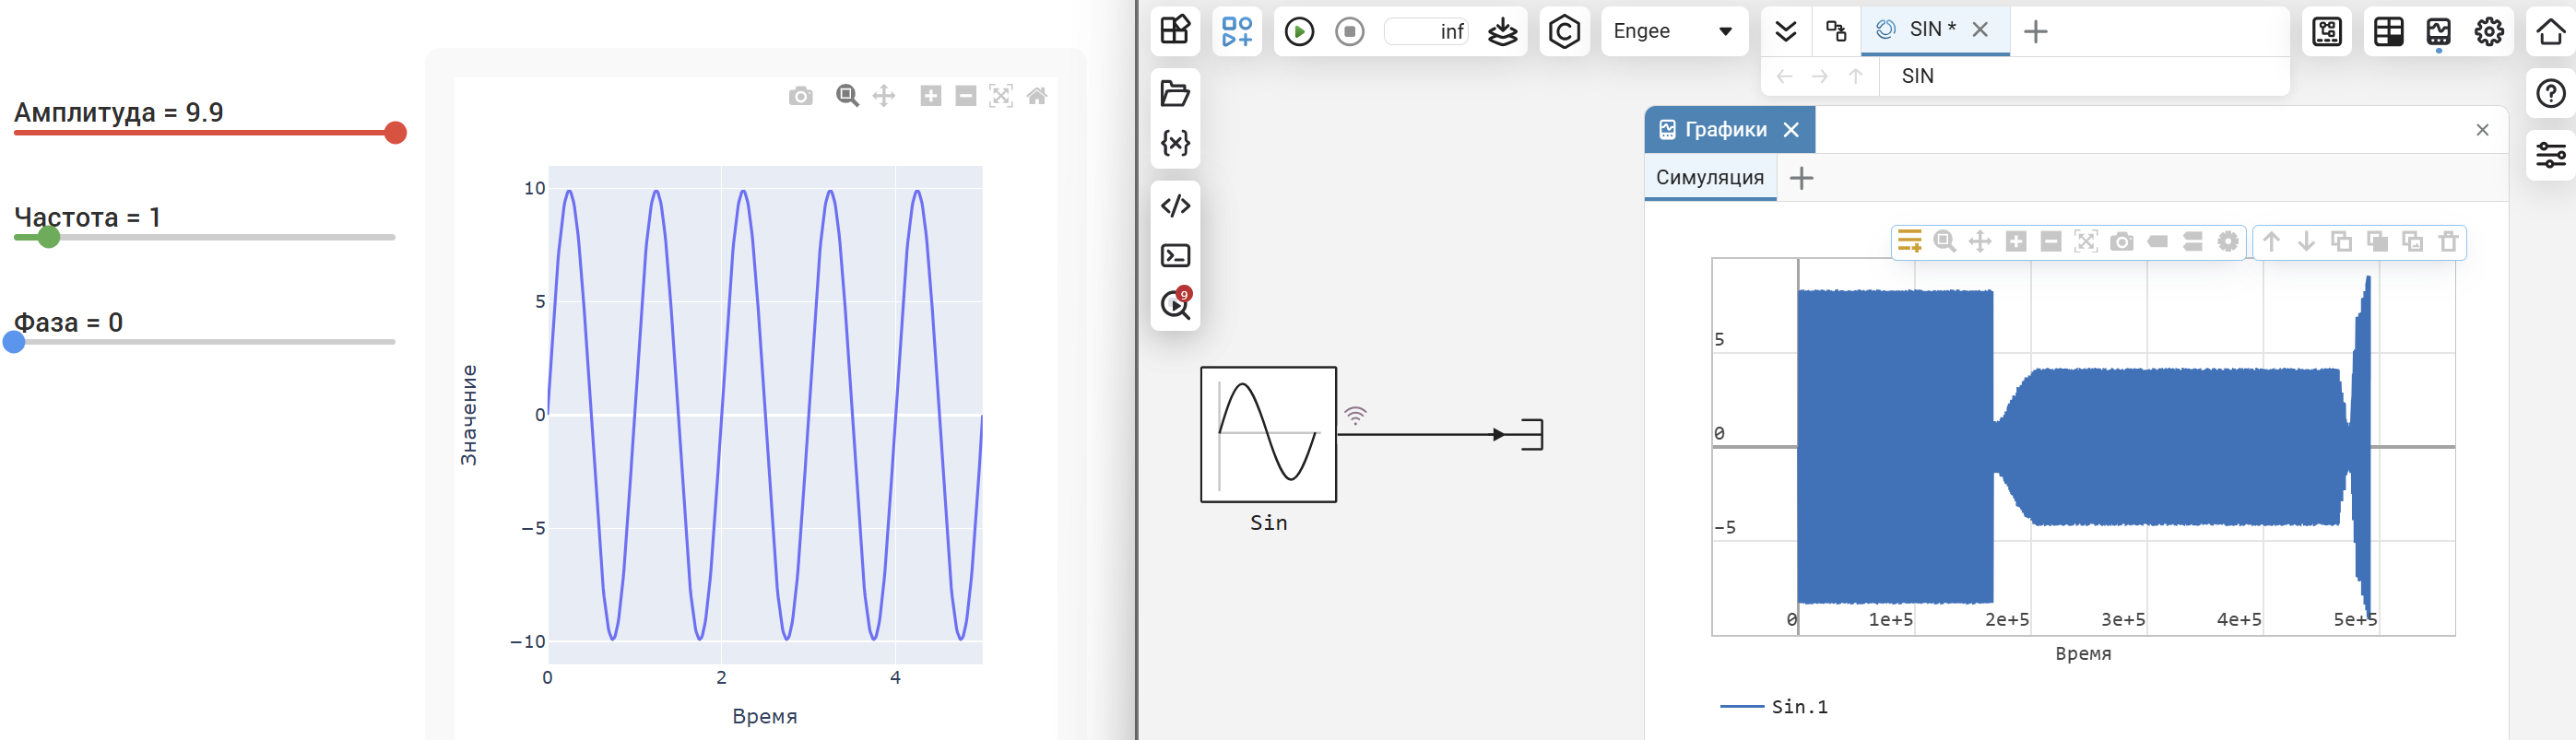
The figure below shows the behavior of the model under the control of a web application.
You can turn off the application using the following command:
# engee.genie.stop(string(@__DIR__,"/app.jl"))
Conclusion
This example showed two ways to manage models using GenieFramework at once, and also demonstrated the possibilities of using team management to implement larger projects in this area.