Measurement of the transition time in the RL circuit
In this example, an RL circuit diagram is assembled in which a transient process occurs, and a subsystem for measuring the time of the transient process.
Description of the model
At a moment in time current source Controlled Current Source (block ControlledCurrent) receives a stepwise signal of 6V amplitude. A transient process begins in the circuit, which we will see thanks to the sensor. Current Sensor.
We are interested in the moment when the value at the sensor output enters the 5% accuracy range, that is, when the signal exceeds the value in 0.95 * 6 V.
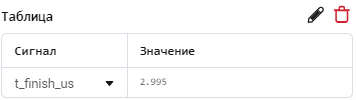
Set of blocks Switch and Delay they are responsible for storing information about the simulation time (block Clock), which has elapsed from the start of the model launch until the signal exceeds the threshold value. After that, the output value of the blocks is Switch and Delay * freezes*. We can see it on the chart panel in tabular form, where it is displayed in microseconds.
.png)
Before the tube reaches 95% accuracy, the transition process should take approximately seconds, where (time constant). In our case, the time constant is 1 microsecond, and this is consistent with the observed duration of the transient process.: 2.995 microseconds.
Launching the model
Let's launch the model RL_circuit_transition_time using software management tools:
# We will load the model if it is not already open on the canvas.
if "RL_circuit_transition_time" ∉ getfield.(engee.get_all_models(), :name)
    engee.load( "$(@__DIR__)/RL_circuit_transition_time.engee");
end

model_data = engee.run( "RL_circuit_transition_time" );
Let's build a graph:
iL = model_data["Il"].value

plot( model_data["Il"].time, iL, xlabel="Time, from", label="Current through the coil, A", lw=2 )
vline!( [model_data["t_finish_us"].value[end] ./ 1e6], label="Duration of the transition process" )
hline!( [0.95 .* (iL[end] - iL[1])], linecolor=3, ls=:dash, label="Threshold ± 5%" )
hline!( [1.05 .* (iL[end] - iL[1])], linecolor=3, ls=:dash, label=:none )
We can see that the model has very accurately measured the duration of the transition process, because it is at that moment, marked with a red line on the graph, that the measured process enters the tube with an accuracy of ± 5%.
Conclusion
We easily built a model to study the transient process in the RL circuit and, using several additional blocks, obtained the duration of the transient process as another signal within the model that can be visualized or used, for example, to optimize it.