DC motor
This example will demonstrate the DC motor models created in Engee (model ssc_dcmotor.engee) and in Simulink (model ssc_dcmotor_demo.slx). The process of launching models from the script development environment using command control and comparing the simulation results will be shown. In the simulation, an alternating torque acts on the shaft of the electric motor.
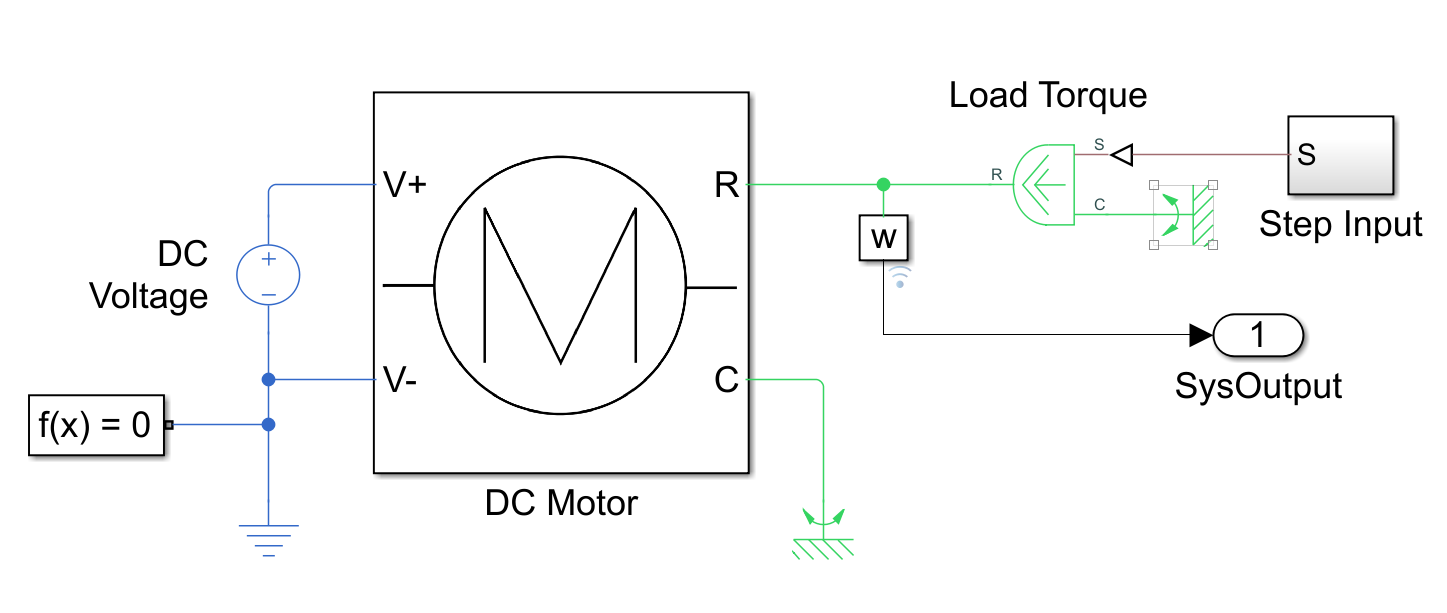
General view of the models
The Engee model:

The Simulink model:
Launching the model using software control
Pkg.add(["Statistics", "CSV"])
using Plots
using MATLAB
using CSV
using DataFrames
using Statistics

demoroot = @__DIR__

mat"start_simulink"
mat"p = $demoroot; addpath(p);"
mat"p = '/user/start/examples/helper_units'; addpath(p);"
Loading the model:
modelName = "ssc_dcmotor";
dcmotor_model = modelName in [m.name for m in engee.get_all_models()] ? engee.open( modelName ) : engee.load( "$(@__DIR__)/$(modelName).engee");
Launching the uploaded model:
results = engee.run( modelName )
Simulation results:
W_en_t = results["omega"].time;
W_en_w = results["omega"].value;
Visualization of results
Output of a graph of the dependence of the engine speed on time:
plot(W_en_t , W_en_w, legend = false)
plot!(title = "Simulation results in Engee", ylabel = "Engine rotation speed, rpm", xlabel="Time, c")
Launching the Simulink model:
mat"run_test_model('ssc_dcmotor_demo');";
Output of a graph of the dependence of the engine speed on time:
W_sim_w = mat"SysOutput.Data";
W_sim_t = mat"SysOutput.Time";
plot(W_sim_t, W_sim_w, legend = false)
plot!(title = "Simulation results in Simulink", ylabel = "Engine rotation speed, rpm", xlabel="Time, c")
Let's compare the simulation results in Engee and Simulink. To do this, let's compare the speed values.
plot(W_en_t , W_en_w, label = "Engee")
plot!(title = "Comparison of simulation results")
plot!(W_sim_t,W_sim_w, label = "Simulink")
plot!(ylabel = "Engine rotation speed, rpm", xlabel="Time, c")
Conclusions:
In this example, tools for command management of the model were used, and therefore the Engee and Simulink models were launched from the script. The simulation results were saved to csv files, uploaded, visualized, and analyzed using interactive graphs from the Plots library. A visual analysis of the results showed that the models of electric cars created in both Engee and Simulink are identical.