Simulation of a diode bridge
This example will demonstrate a solution to a classic electrical engineering problem – converting an alternating voltage to a constant one. This problem is solved with the help of rectifiers. One of the rectifier options is a bridge circuit:
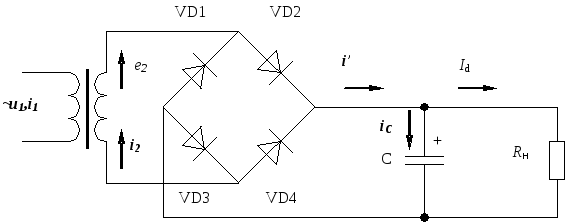
Consider the corresponding scheme in Engee (model ssc_bridge_rectifier.engee):

The rectifier is modeled here using blocks from the library of electrical components.
Pkg.add(["Statistics", "CSV"])
using Plots
using MATLAB
using CSV
using DataFrames
using Statistics

demoroot = @__DIR__;
mat"start_simulink"
mat"p = $demoroot; addpath(p);"
mat"p = '/user/start/examples/helper_units'; addpath(p);"
Implementation of the model launch using software control:
Loading the model:
modelName = "ssc_bridge_rectifier";
model = modelName in [m.name for m in engee.get_all_models()] ? engee.open( modelName ) : engee.load( "$(@__DIR__)/$(modelName).engee");
Launching the uploaded model:
results = engee.run( modelName )
Loading and visualizing the data obtained during the simulation.
Let's plot the rectified voltage graph:
Bridge_Engee_t = results["DC Voltage"].time;
Bridge_Engee_d = results["DC Voltage"].value;
p_adc_da_e = plot(Bridge_Engee_t ,Bridge_Engee_d , legend = false)
plot!(title = "Simulation results in Engee", ylabel = "Voltage, V", xlabel="Time, c")
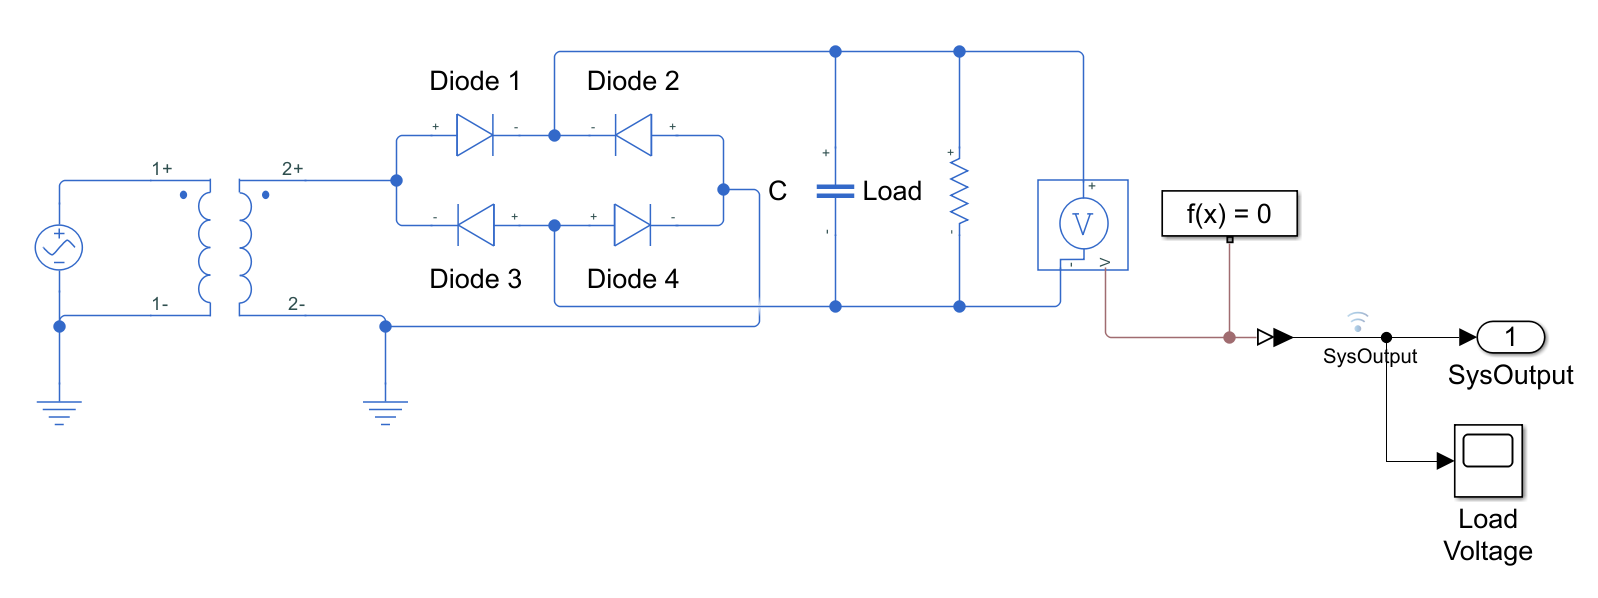
Comparison with Simscape
The same scheme can be modeled in SimScape:
Running the model in Simulink and loading the results into variables:
mat"run_test_model('ssc_bridge_rectifier_demo');";
sl_rect_values = mat"SysOutput.Data";
sl_rect_times = mat"SysOutput.Time";
Let's look at the simulation results in SimScape:
plot(sl_rect_times, sl_rect_values, legend = false)
plot!(title = "Simulation results in Simulink", ylabel = "Voltage, V", xlabel="Time, c")
Let's compare the graphs:
plot(Bridge_Engee_t ,Bridge_Engee_d, label = "Engee")
plot!(title = "Comparison of simulation results")
plot!(sl_rect_times, sl_rect_values, label = "Simulink")
plot!(legend = :outertopright,ylabel = "Digital signal", xlabel="Time, c")
Conclusion:
In this example, the simulation of a diode rectifier was demonstrated using the command control of the model in the Engee script editor, as well as running the model from the Simulink environment. The calculations showed a minimal difference in the results when running the simulation in these two environments.