Transformer simulation
This example simulates the change in current and voltage when passing through a transformer.
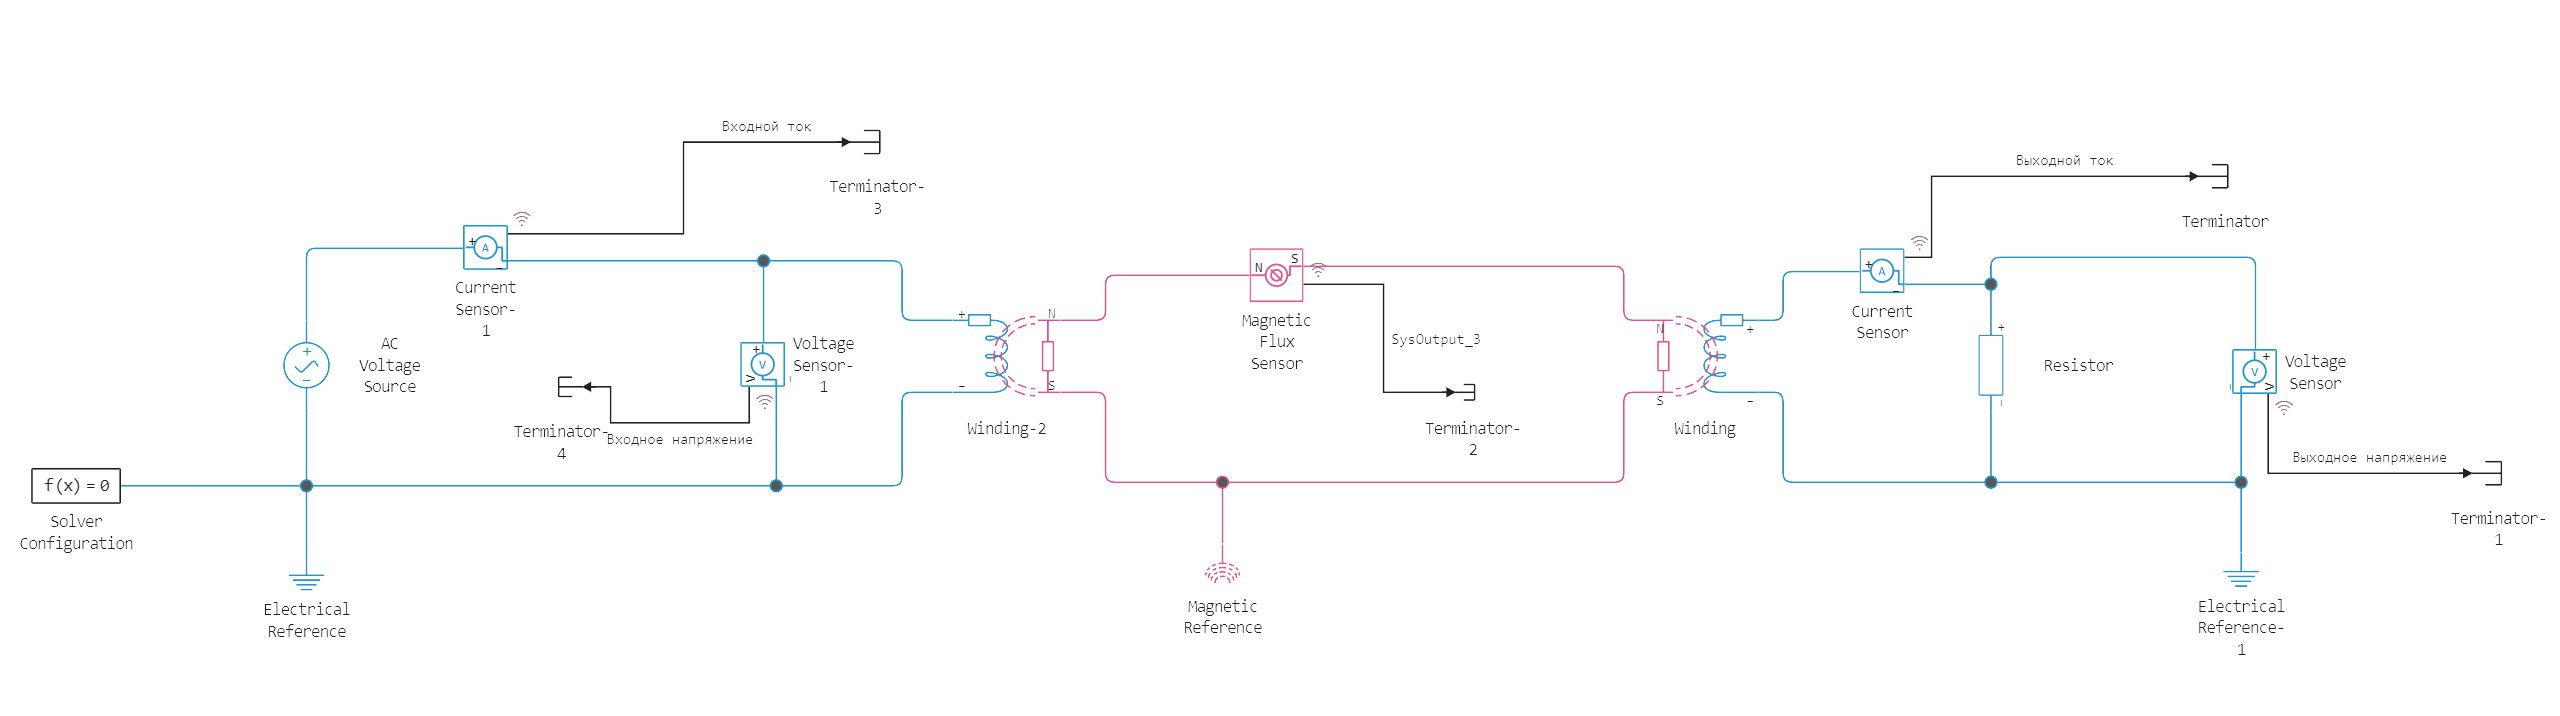
Model diagram:
Simulation results:
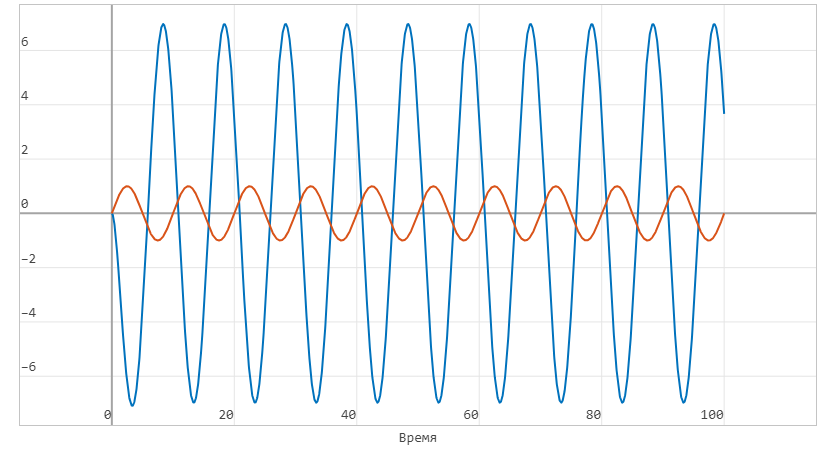
Graph of the dependence of the input and output voltage (on the primary and secondary windings, respectively):

Graph of the dependence of the input and output current (on the primary and secondary windings, respectively):
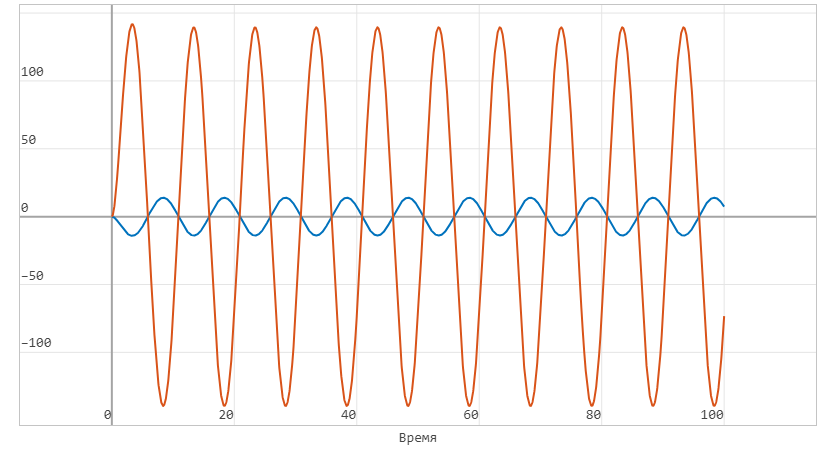

Conclusion:
Analyzing the current graph, you can see that it dropped exactly 10 times when passing through the transformer, from 139 A to 13.9 A, which is inversely proportional to the change in the number of turns on the primary and secondary windings, 10 and 100, respectively.