Noise-based operational amplifier simulation
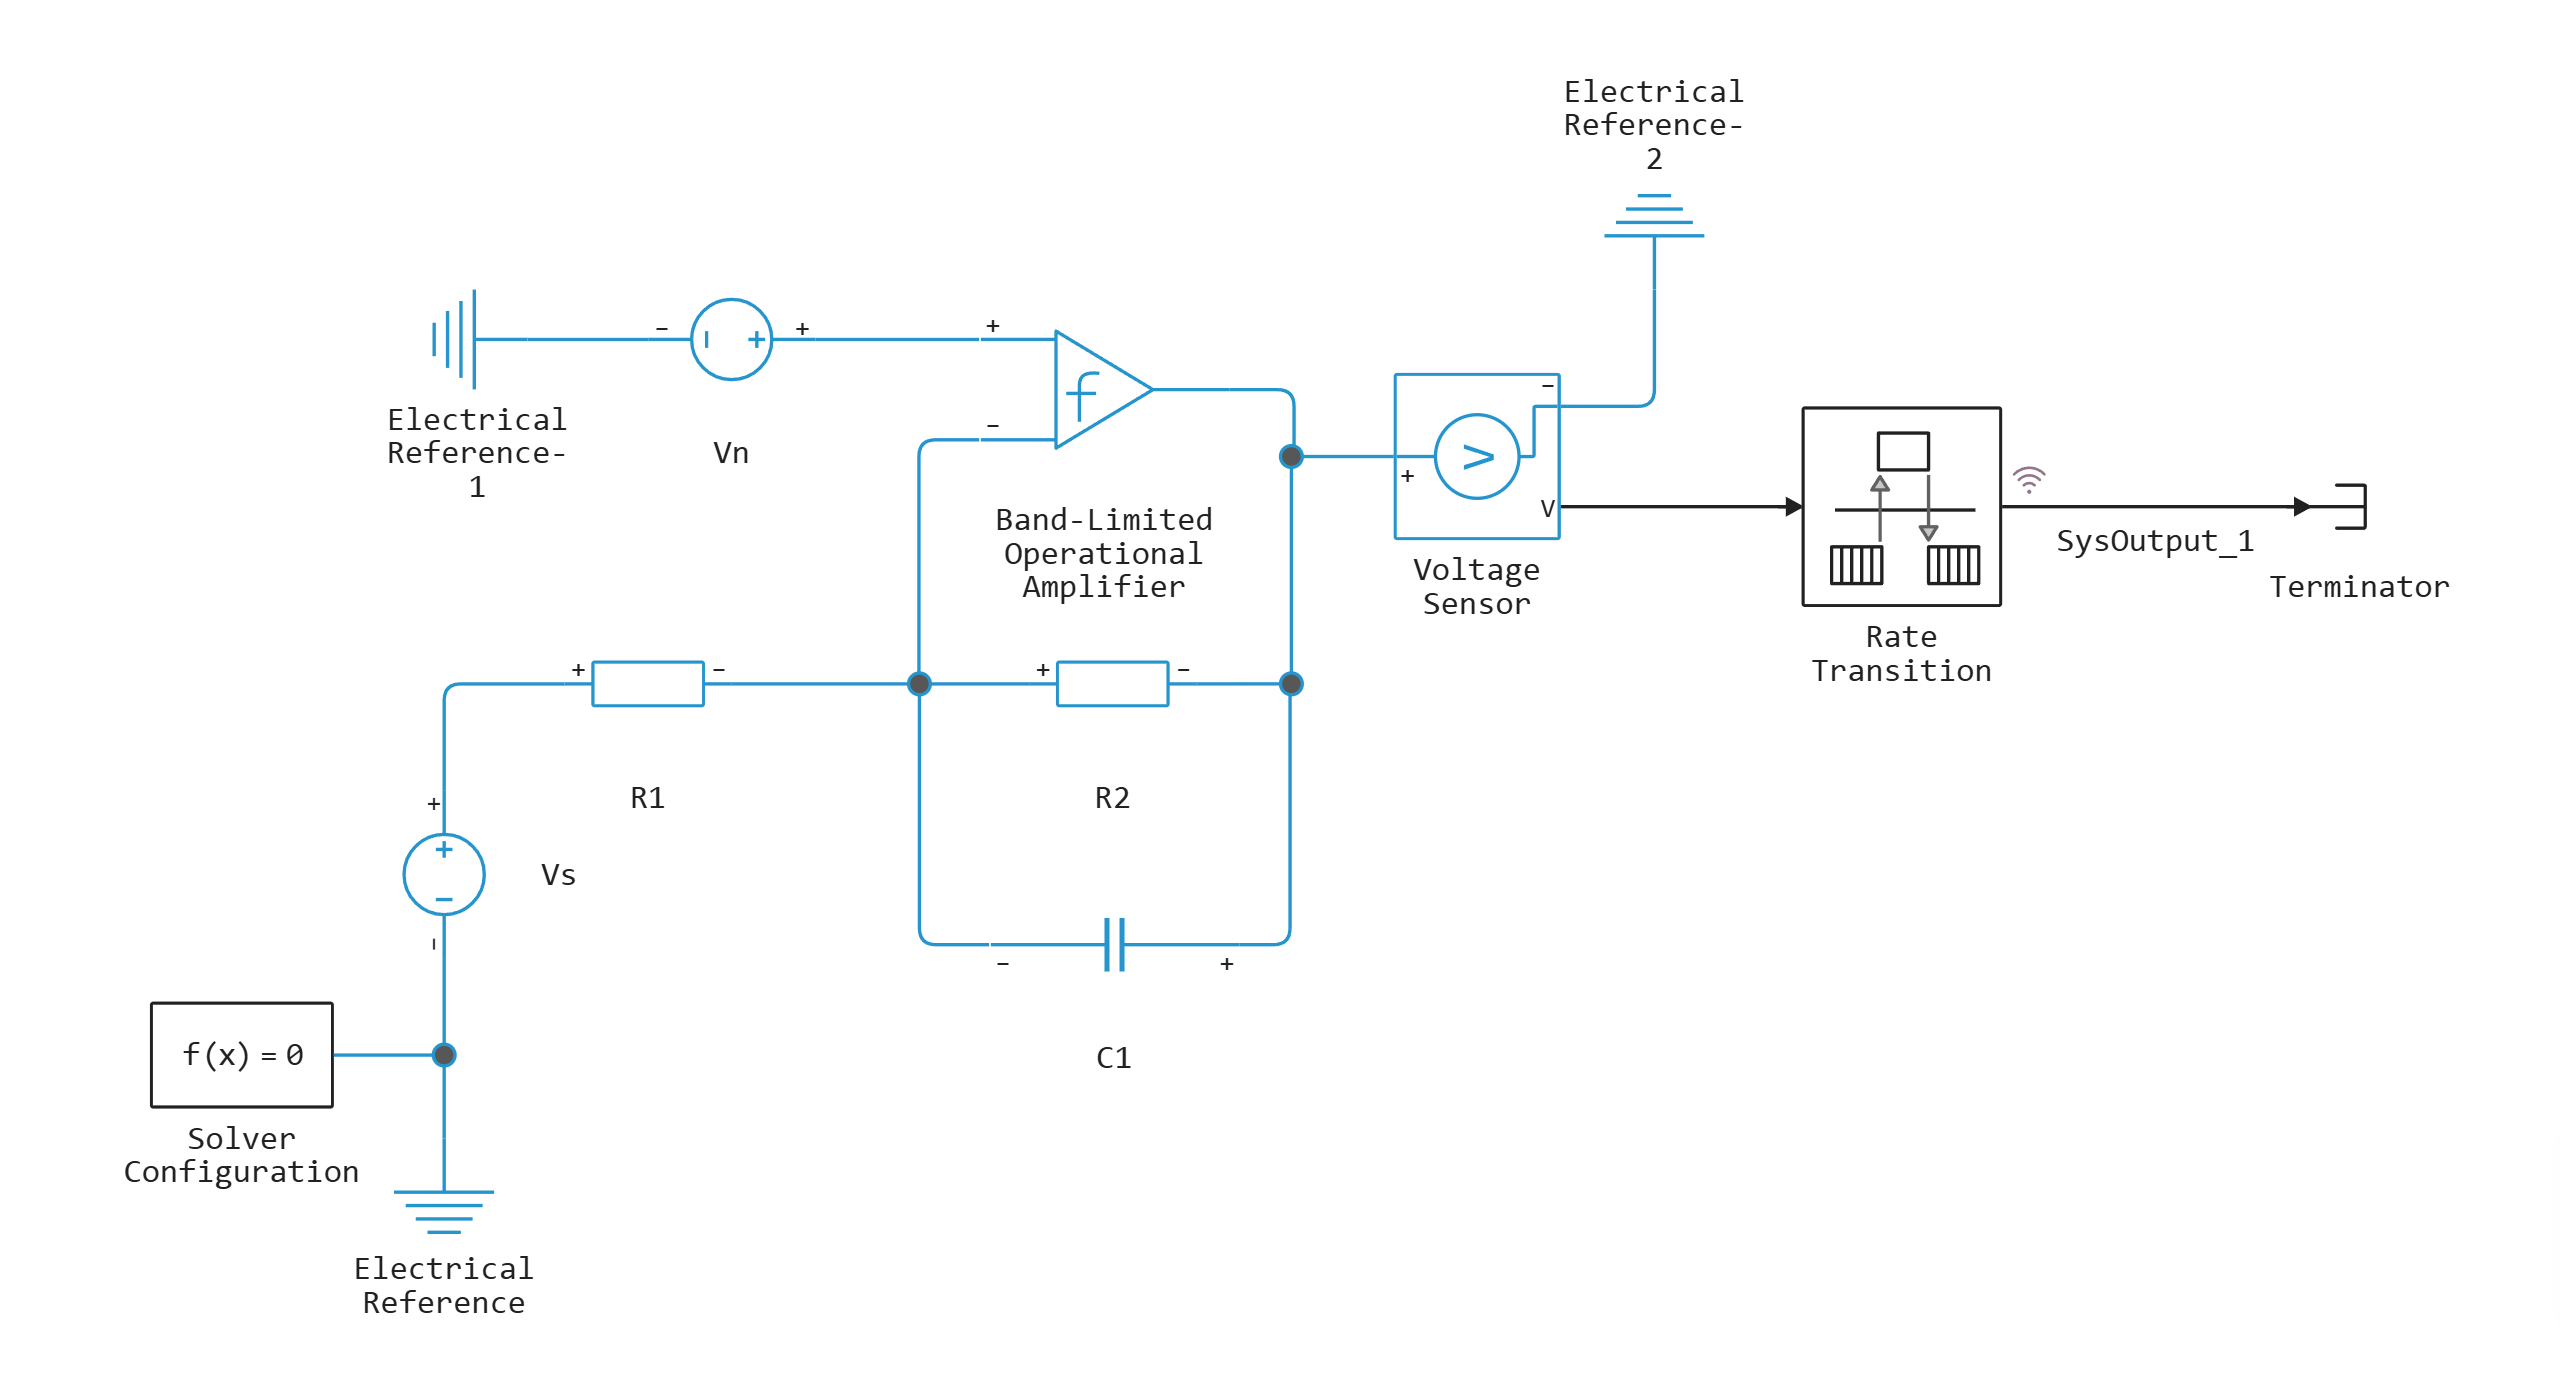
This example demonstrates one of the methods for modeling noise in electrical circuits. The circuit is an amplifier with a cutoff frequency of 10 MHz, where noise effects are generated by an operational amplifier unit with limited bandwidth (Band-Limited Operational Amplifier). The voltage source Vn sets an equivalent spectral noise density of 20 .
Model diagram:
Defining the function to load and run the model:
In [ ]:
function start_model_engee()
    try
        engee.close("op_amp_with_noise", force=true) # closing the model
        catch err # if there is no model to close and engee.close() is not executed, it will be loaded after catch.
            m = engee.load("$(@__DIR__)/op_amp_with_noise.engee") # loading the model
        end;

    try
        engee.run(m, verbose=true) # launching the model
        catch err # if the model is not loaded and engee.run() is not executed, the bottom two lines after catch will be executed.
            m = engee.load("$(@__DIR__)/op_amp_with_noise.engee") # loading the model
            engee.run(m, verbose=true) # launching the model
        end
end
Out[0]:
Running the simulation
In [ ]:
start_model_engee();
Writing simulation data to variables:
In [ ]:
t = simout["op_amp_with_noise/SysOutput_1"].time[:]
amp_voltage = simout["op_amp_with_noise/SysOutput_1"].value[:]
Out[0]:
Data visualization
In [ ]:
using Plots
Voltage graph on the amplifier:
In [ ]:
plot(t, amp_voltage, linewidth=2, title="Voltage across the amplifier", xlabel="Time, from", ylabel="Voltage, V", lc=2)
Out[0]:
Frequency response of the amplifier:
.png)