Simulation of a simplified transmission
Introduction:
In this example, we will consider modeling the change in torque in a simplified gearbox using the command control of the model.
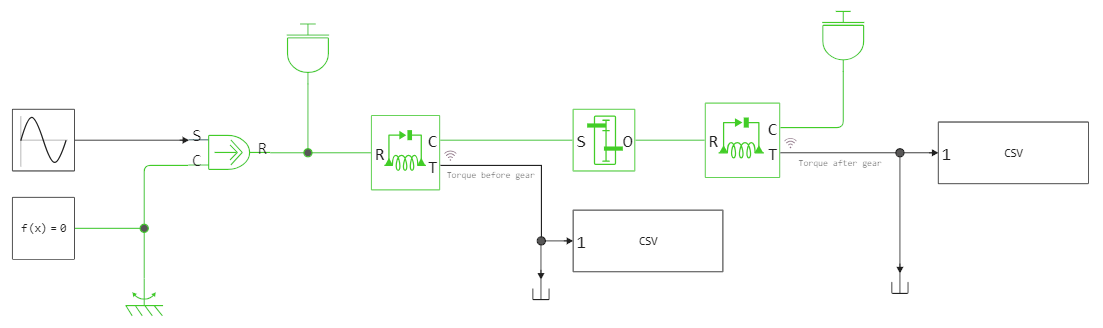
The general view of the model is shown in the figure.
A sinusoidal signal is applied to the input of the torque source, as a result of which a torque is generated in the source aimed at rotating the masses connected to the source.
The masses are interconnected by a single-stage gearbox, with a gear ratio of 2.
With the help of torque sensors, the data is displayed on a graph in the visual modeling interface, using the "To CSV" blocks, they are output to this script.
Implementing a model launch in Engee using software management:
Loading the model:
Pkg.add(["CSV"])
modelName = "gear_torque";
gear_model = modelName in [m.name for m in engee.get_all_models()] ? engee.open( modelName ) : engee.load( "$(@__DIR__)/$(modelName).engee");
Launching the uploaded model:
results = engee.run( modelName );
Downloading and visualizing the data obtained during the simulation
The change in torque during the simulation lies in the results variable:
using CSV, DataFrames
torque_before_gear = results["Torque before gear"]; # loading data about the moment to the gearbox
torque_after_gear = results["Torque after gear"]; # loading data about the moment after the transmission
Connecting the library for charting:
using Plots
Plotting a graph describing the change in torque:
plot(torque_before_gear.time, torque_before_gear.value, xlabel="Time, from", ylabel="The moment, N*m", title="Torque change", linecolor =:red, bg_inside =:white, line =:dashdot, label = "before gearbox")
plot!(torque_after_gear.time, torque_after_gear.value, xlabel="Time, from", linecolor =:blue, bg_inside =:white, line =:solid, label = "after gearbox")
Conclusion:
In this example, the calculation of the change in torque before and after the gearbox was demonstrated.
Software model management was used to run the model and load the results.
The data obtained during the simulation was processed and visualized using a graphics library.