Simulation of gas flow through a throttle
This example demonstrates a change in the characteristics of the gas flow passing through the throttle, which is modeled using the Local Restriction (G) block. The Controlled Reservoir (G) blocks are used to determine the boundary conditions.
There is no gas flow for up to 1 second. The mass flow rate increases as the throttle outlet pressure decreases. The stream is limited for 3.3 seconds. The mass flow rate depends only on the inlet pressure, so a further decrease in outlet pressure does not lead to an additional increase. However, 6 seconds after the start of the simulation, an increase in inlet pressure again leads to an increase in mass flow.
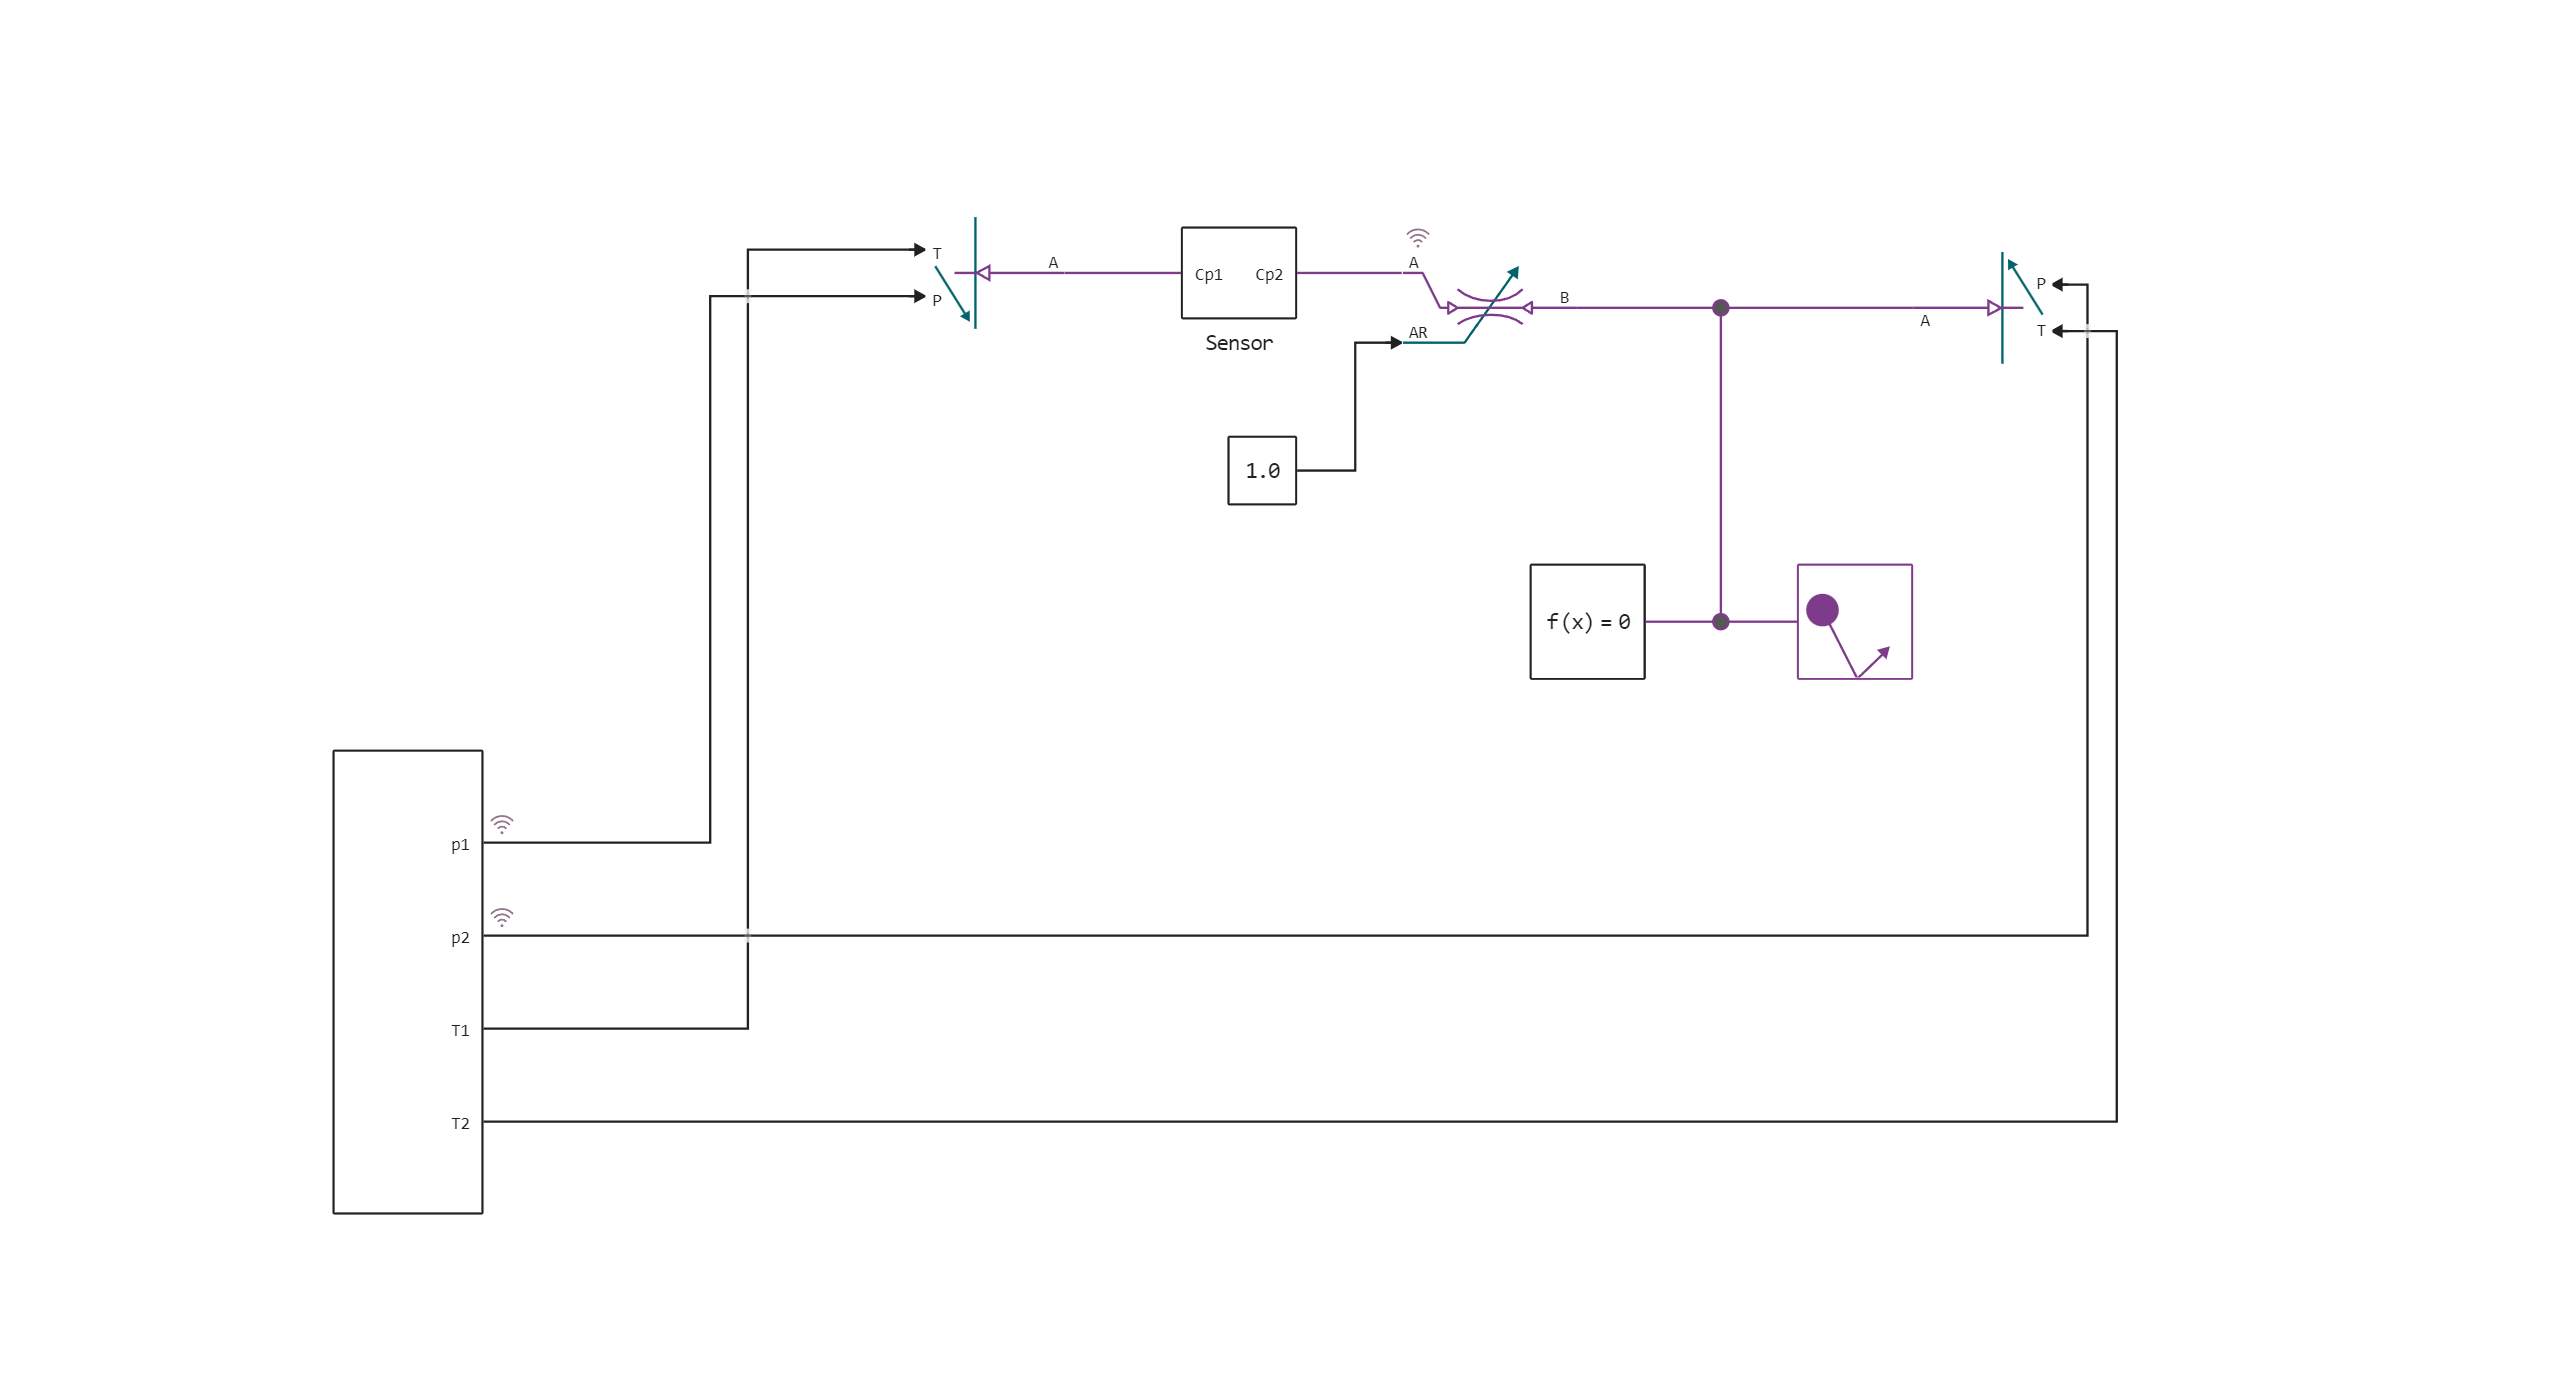
Model diagram:
Simulation results:
Mass flow through the throttle:
.png)
Pressure changes at the inlet and outlet of the throttle:
.png)
The number of Mach in the throttle:
.png)